Why Float Matters More Than Market Cap
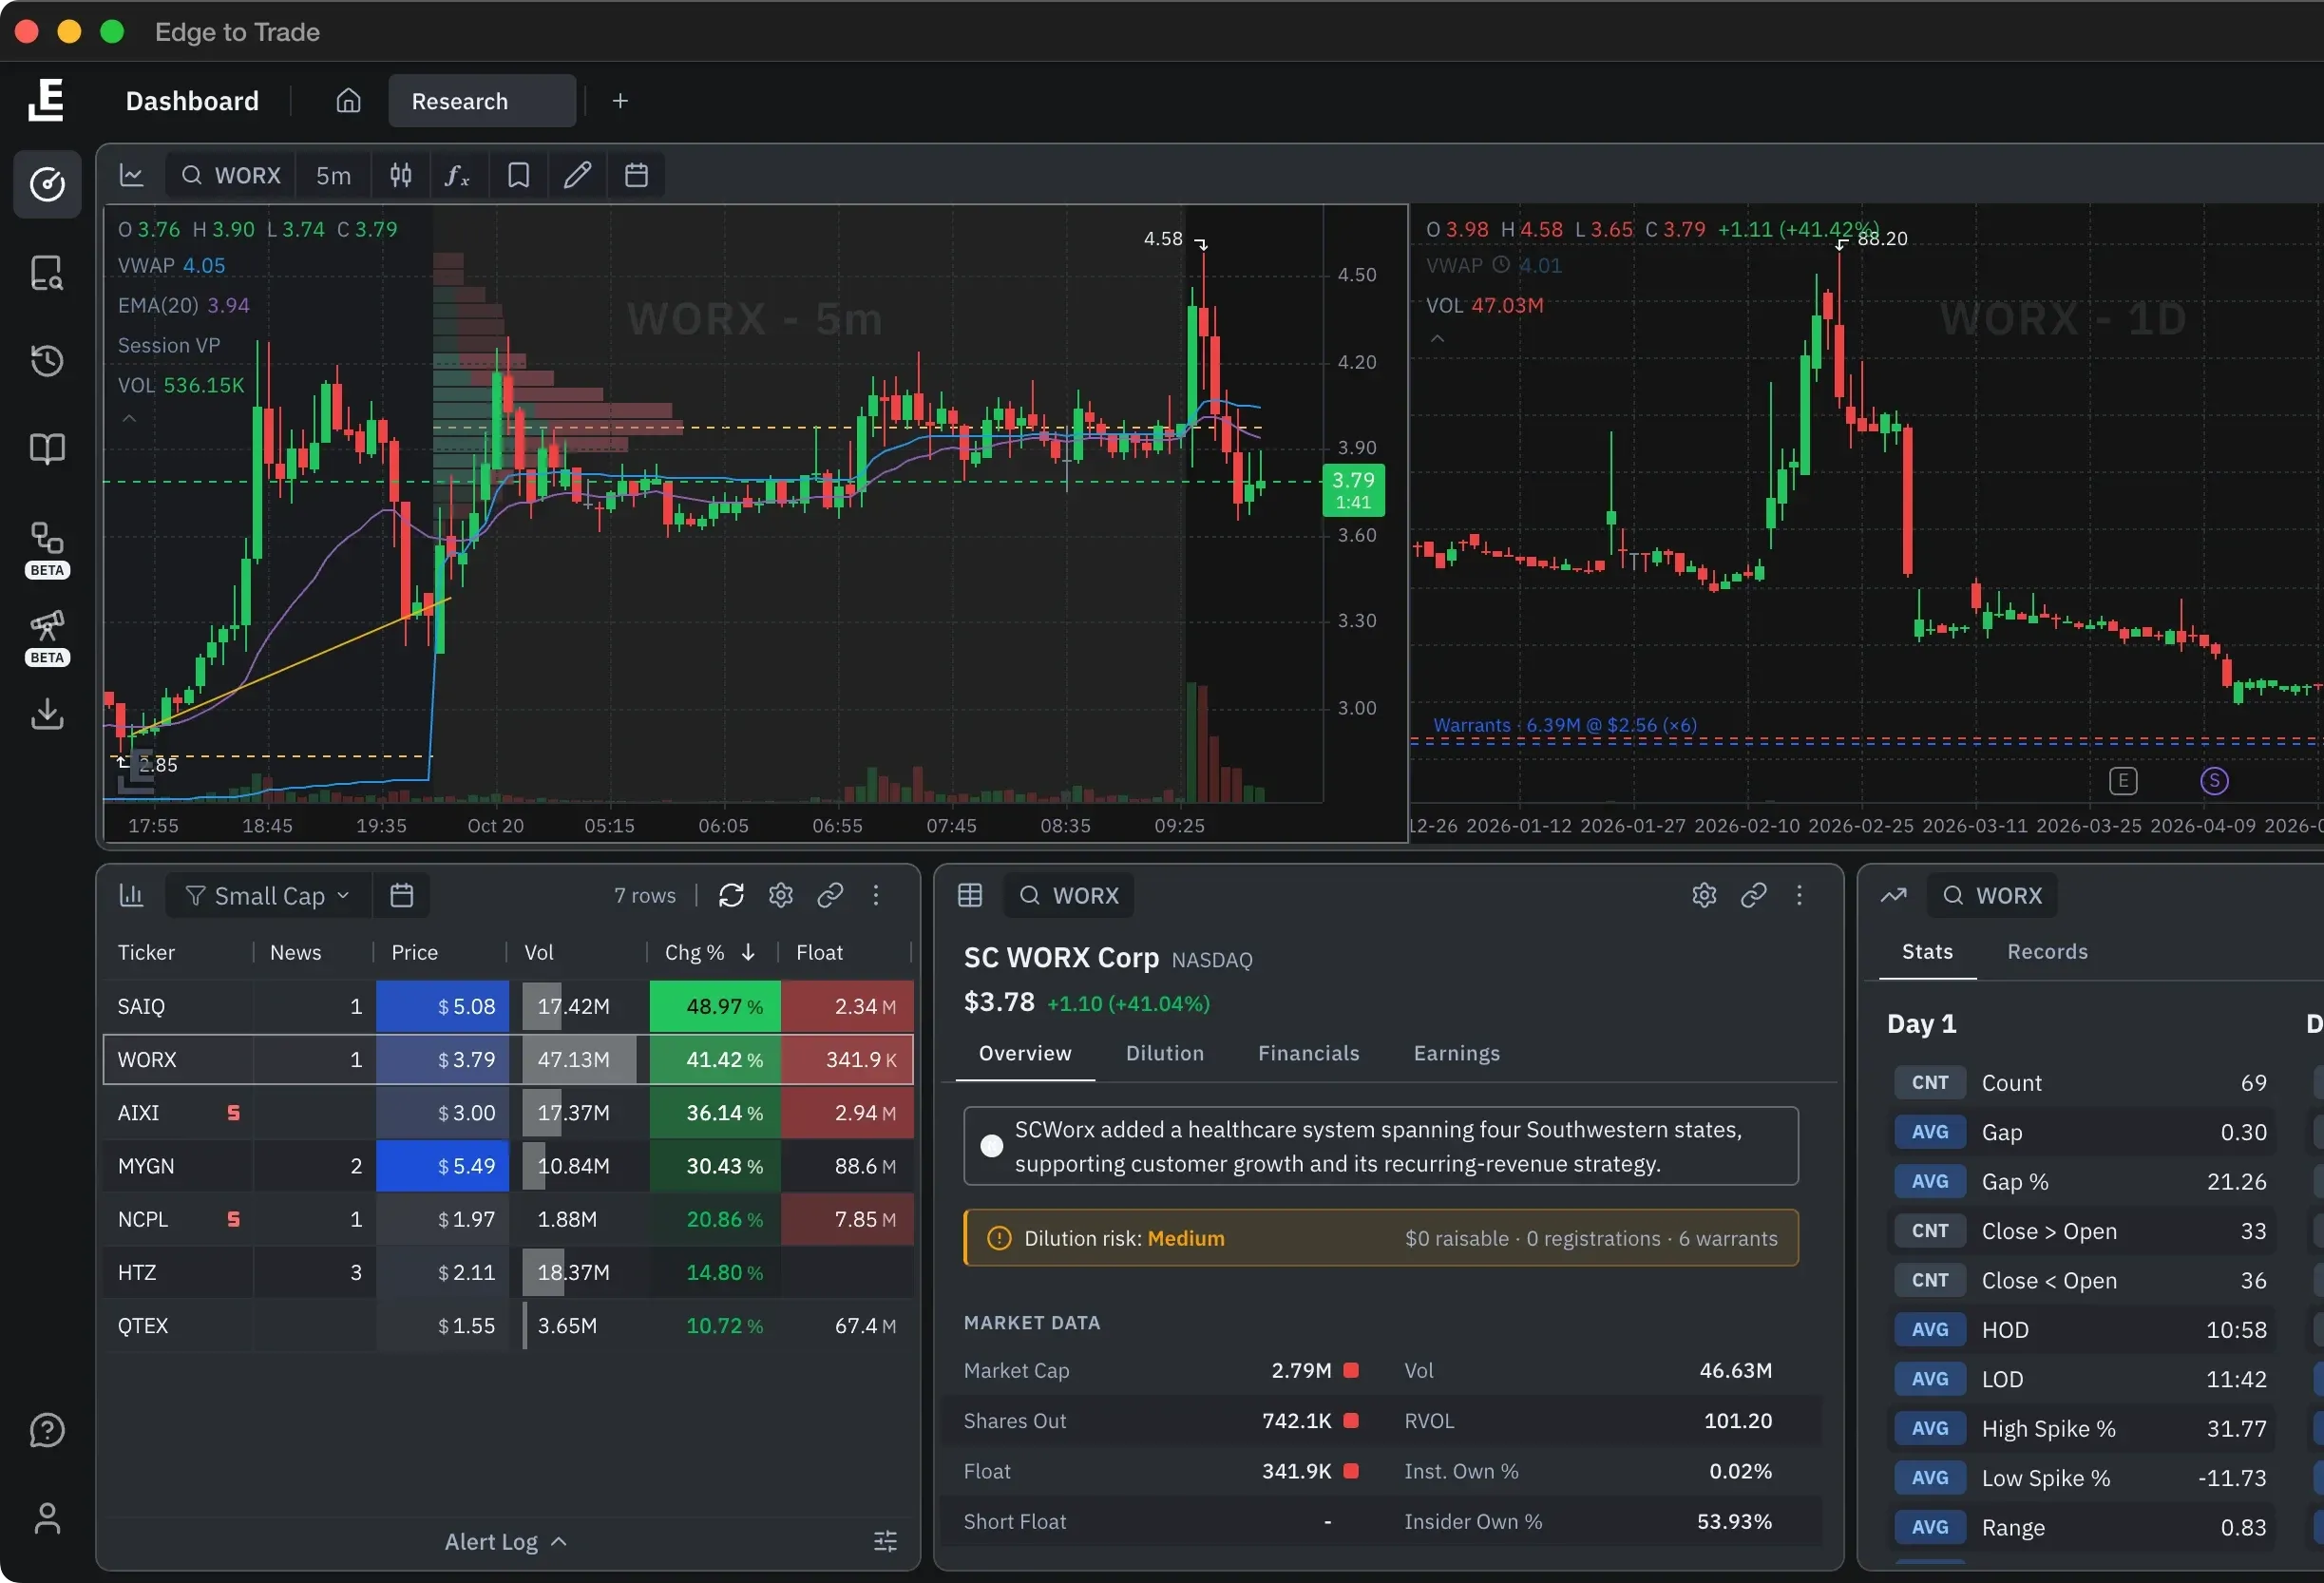
Most retail traders obsess over market cap, but in the small-cap space, float is the real driver of price action. A stock with a 50M market cap and a 2M share float will behave completely differently than one with the same market cap and a 30M float.
Float determines supply. When demand spikes - through news, a catalyst, or social media attention - stocks with smaller floats move faster and further because there are fewer shares available to absorb buying pressure.
Pattern 1: The Low-Float Runner
The classic setup. A stock with under 10M shares floating and a sudden volume spike. When relative volume exceeds 5x the 10-day average on a low-float name, the potential for a multi-hundred-percent move is significantly higher than on high-float stocks.
Key indicators to watch: float under 10M, relative volume above 5x, and a clear catalyst such as an FDA decision, earnings beat, or contract announcement.
Pattern 2: The Dilution Trap
Not all low-float stocks are opportunities. Some companies have a history of diluting shareholders through repeated offerings, warrant exercises, and convertible note conversions. Recognizing this pattern early can save you from being on the wrong side of a sudden float increase.
Check the company's SEC filing history for shelf registrations, ATM offerings, and conversion terms on outstanding notes. Edge to Trade flags these automatically in our share structure analysis.
Pattern 3: The Float Lock
A float lock occurs when a significant portion of outstanding shares are held by insiders, institutions, or restricted stock agreements, effectively reducing the tradeable float below what most data providers report. These situations create explosive moves because the real supply is even tighter than it appears.
Pattern 4: The Offering Recovery
After a company completes a direct offering, the stock often drops 20-40% on dilution fears. However, if the offering is at a fixed price and the company uses proceeds productively, these dips can become excellent entry points. The key is understanding the offering terms and the company's cash position post-offering.
Pattern 5: The Buyback Squeeze
When a company announces a share buyback program, it reduces the available float over time. Combined with positive catalysts, a shrinking float can create a sustained squeeze. Look for companies with strong cash flow, authorized buyback programs, and consistent execution on their repurchase plans.
These five patterns form the foundation of informed small-cap trading. Master them, and you'll have a significant edge over traders who only look at price and volume.