Charting
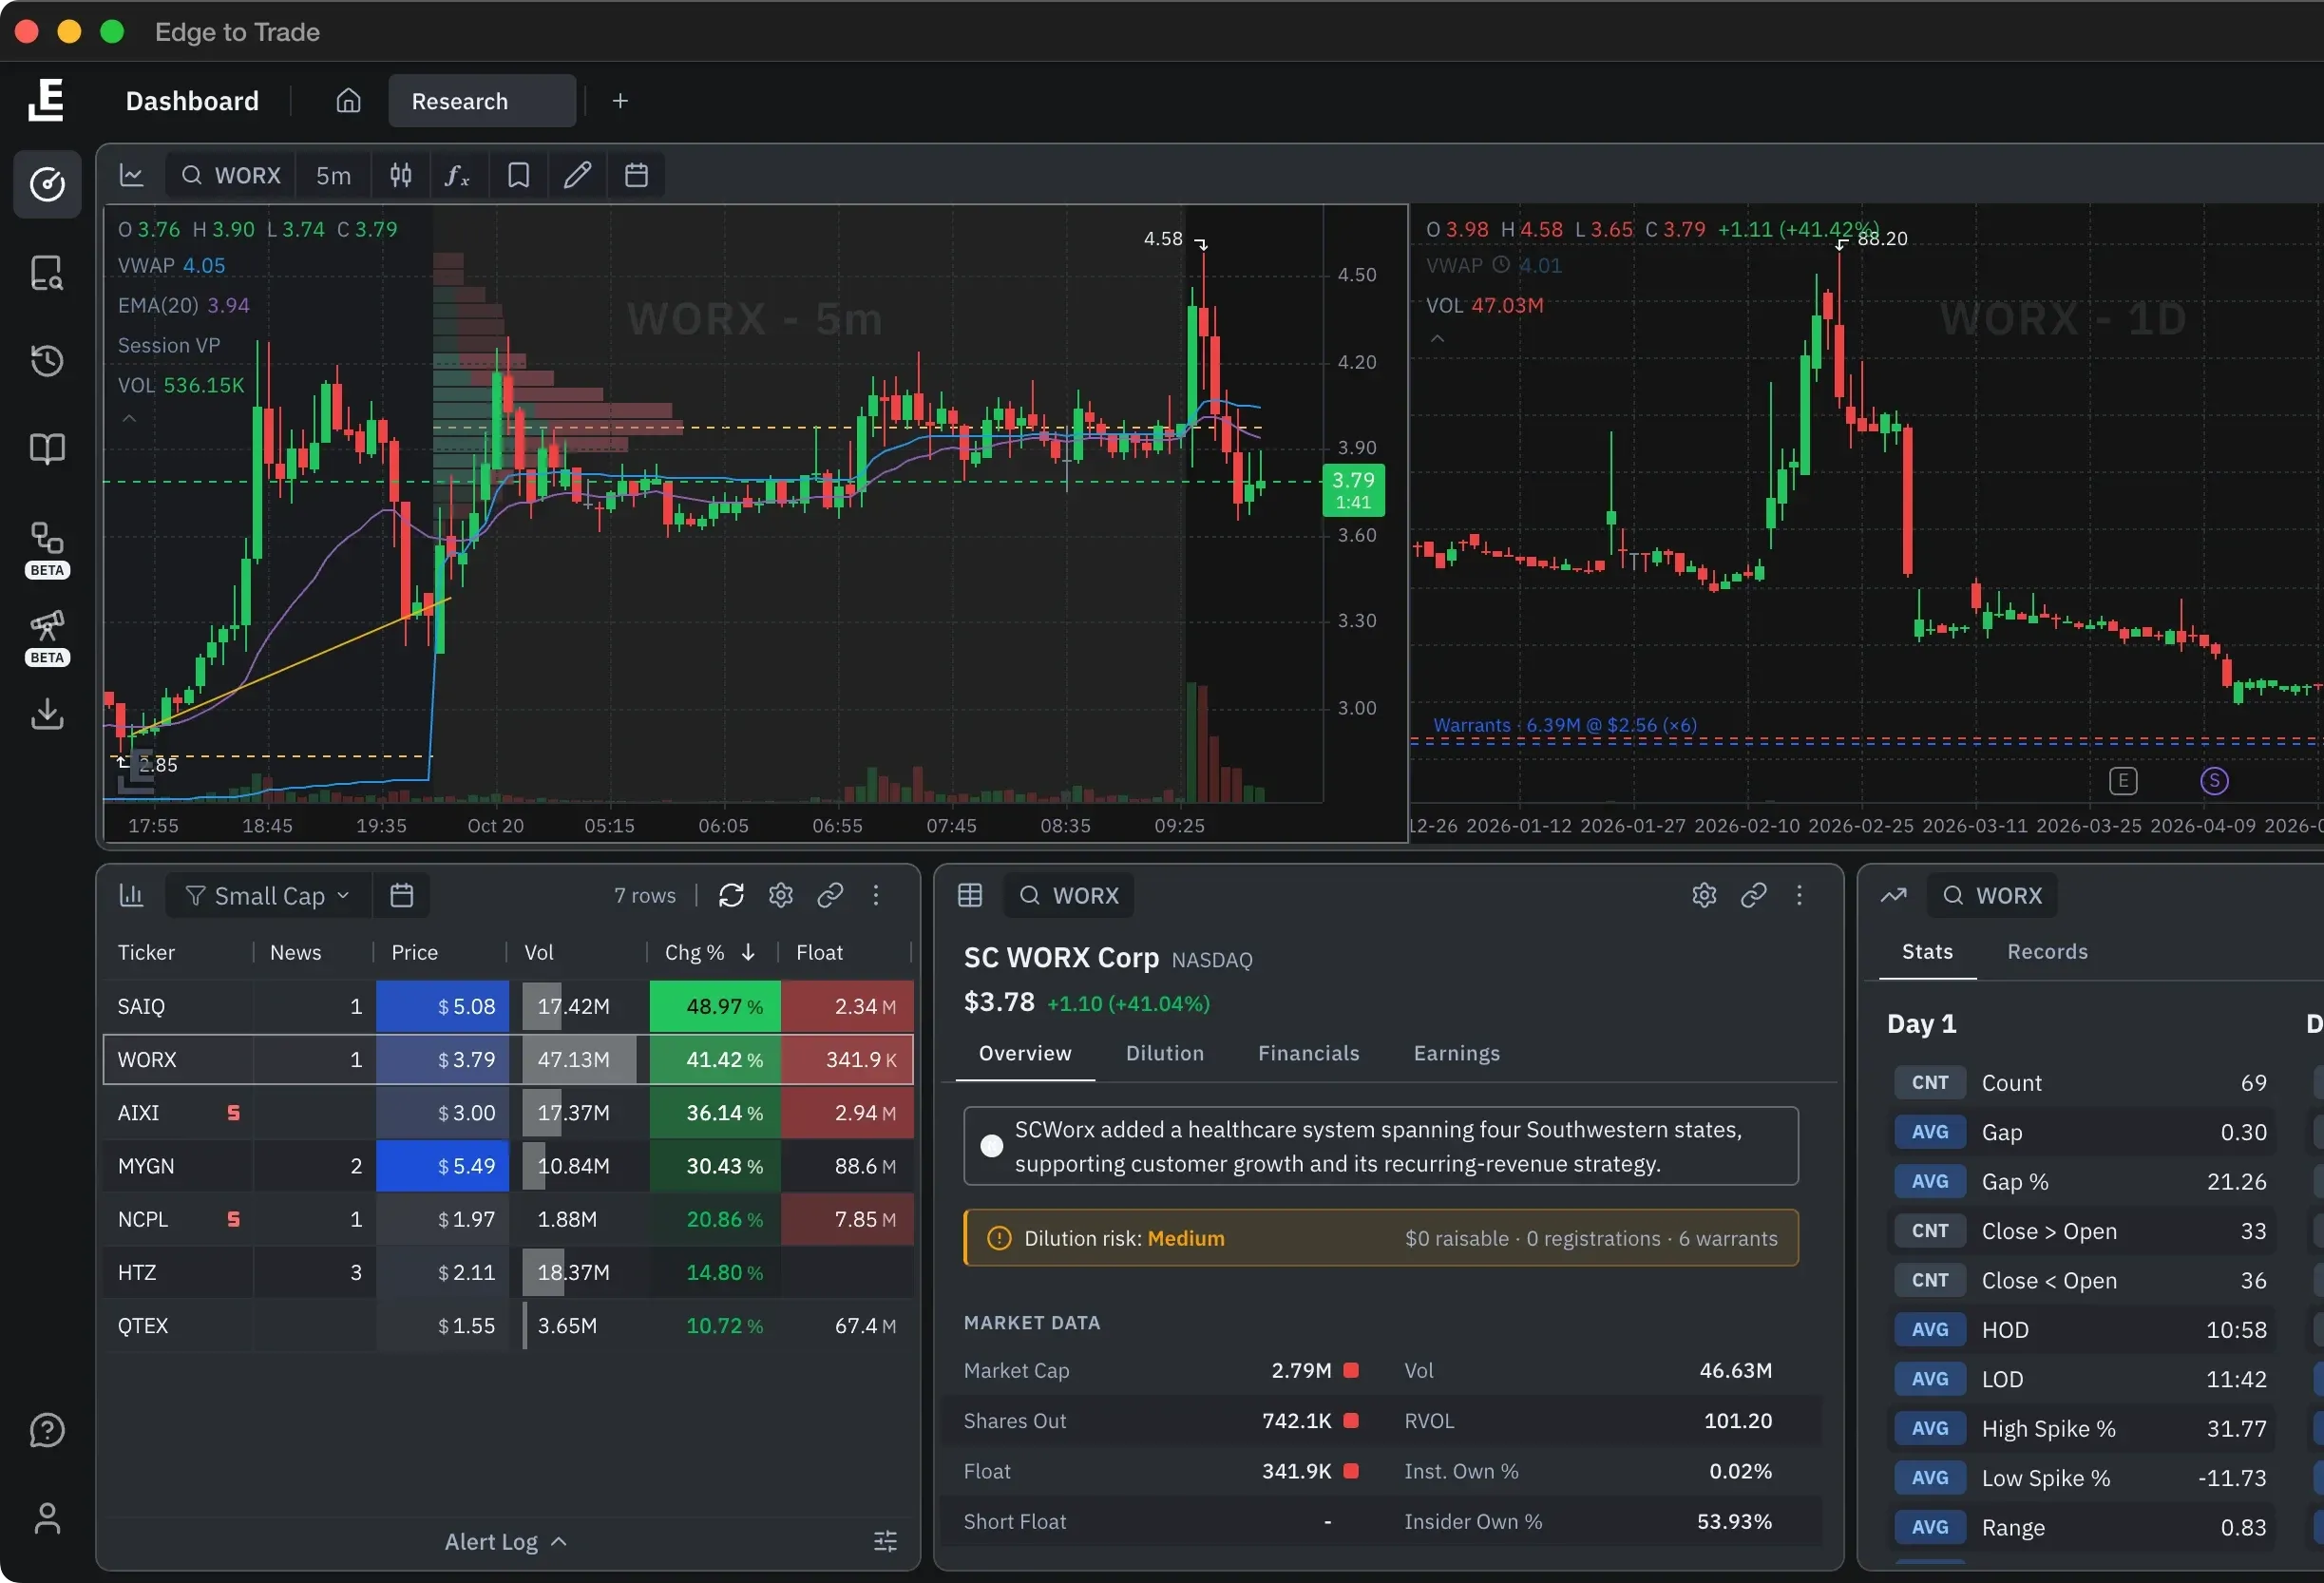
Fast charts. Warrants and offerings drawn in.
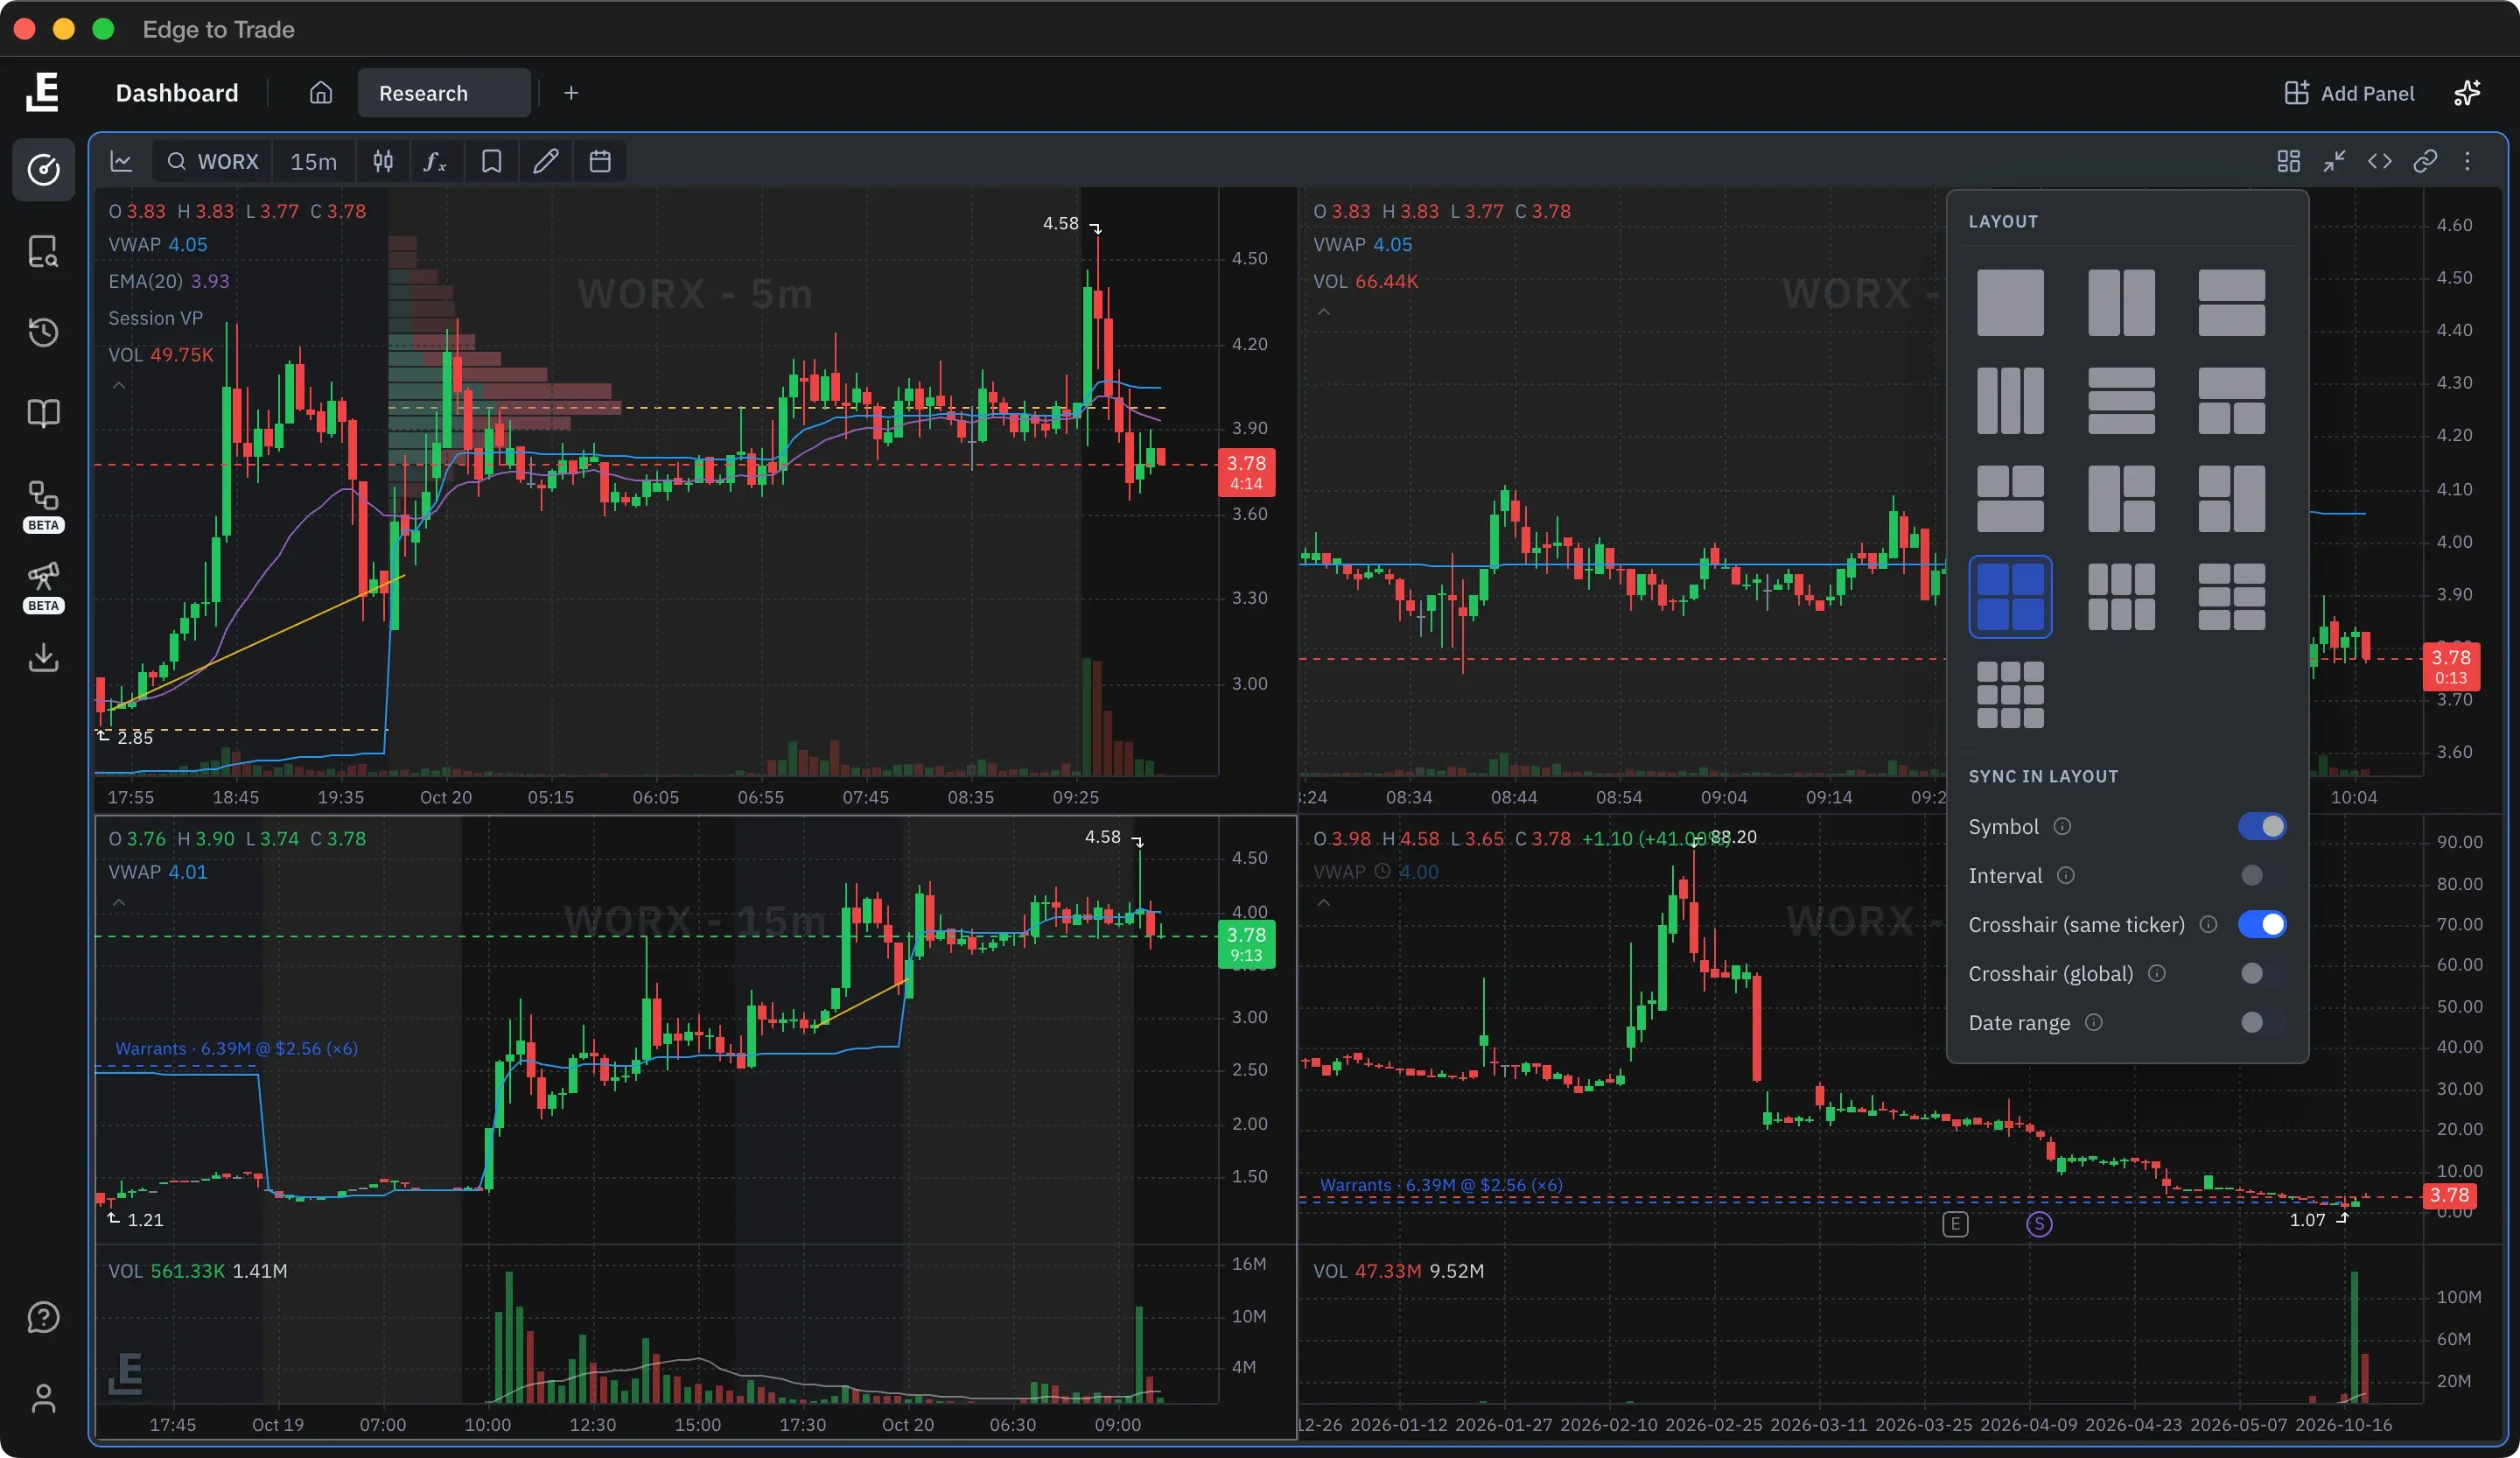
Up to nine charts in one panel, synced crosshairs, bar replay, and warrant strikes and offering prices drawn as price levels.
On every planMulti-ticker chart grids are on ProCompare plans
Charting
Up to nine charts in one panel, synced crosshairs, bar replay, and warrant strikes and offering prices drawn as price levels.
On every planMulti-ticker chart grids are on ProCompare plans
Replay & tagsOnly on ETT
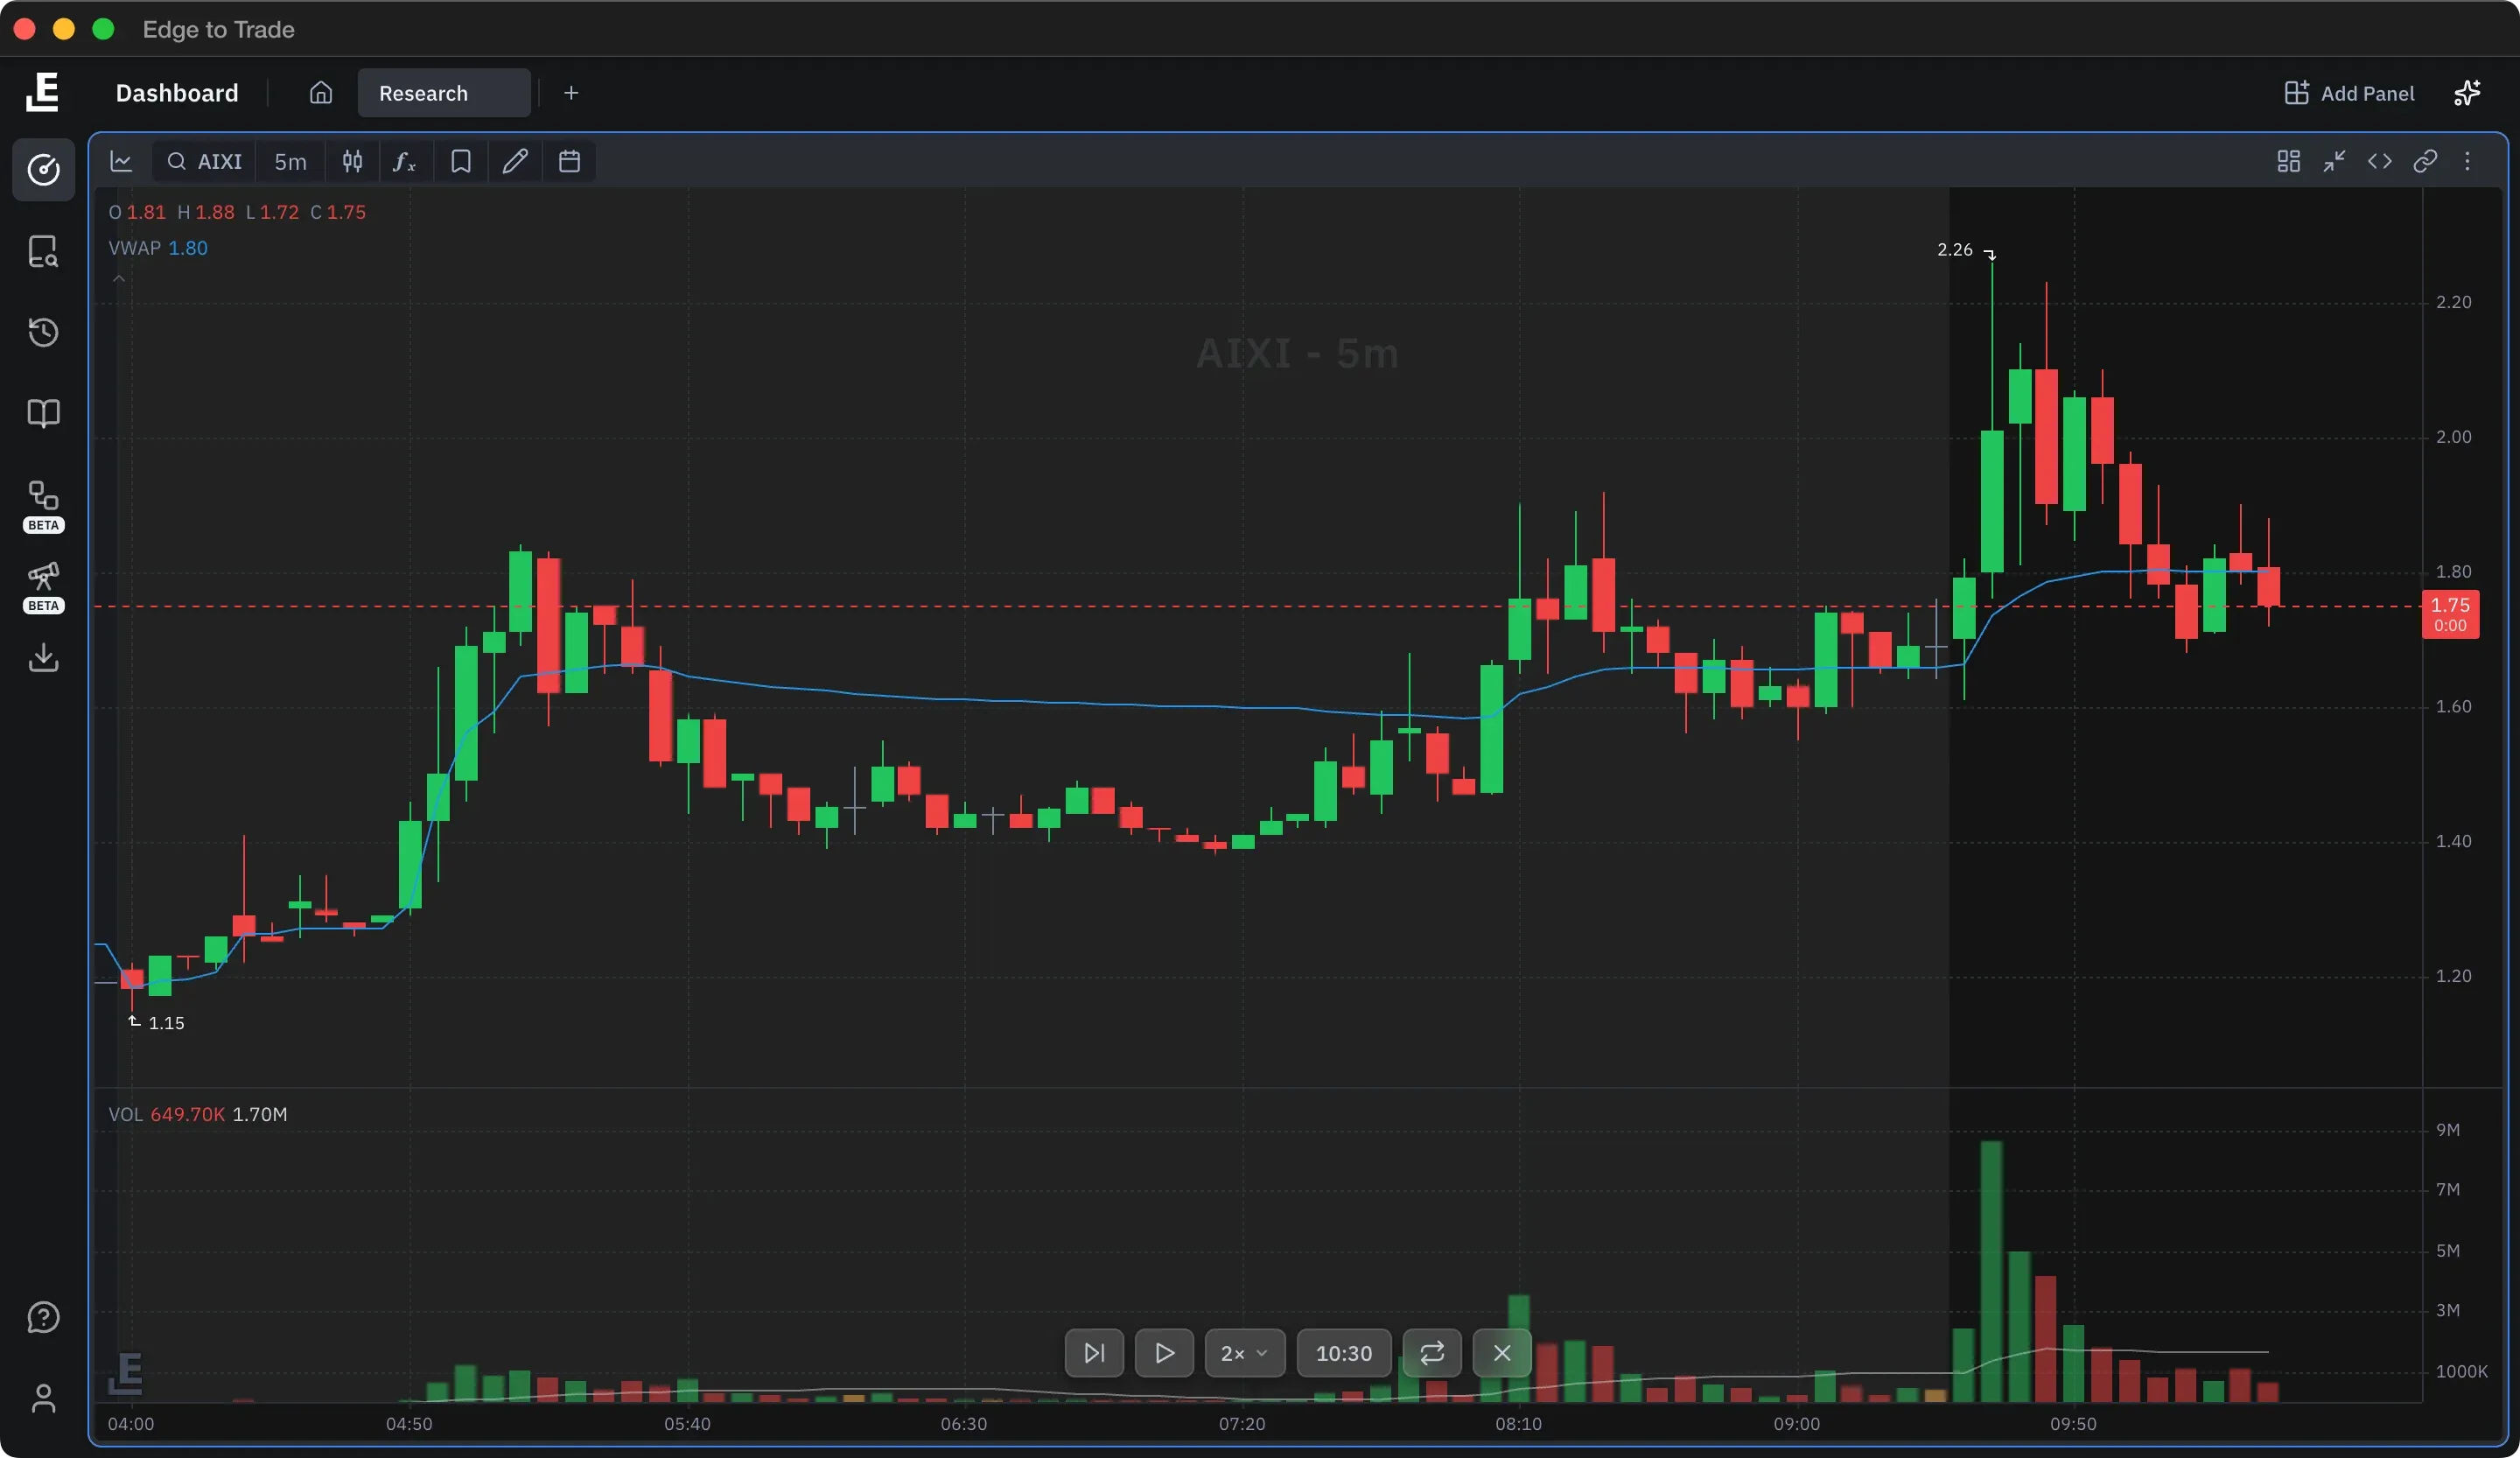
Start a replay from any past day and the chart hides every later bar, then plays them back at the speed you pick.
Dilution levels
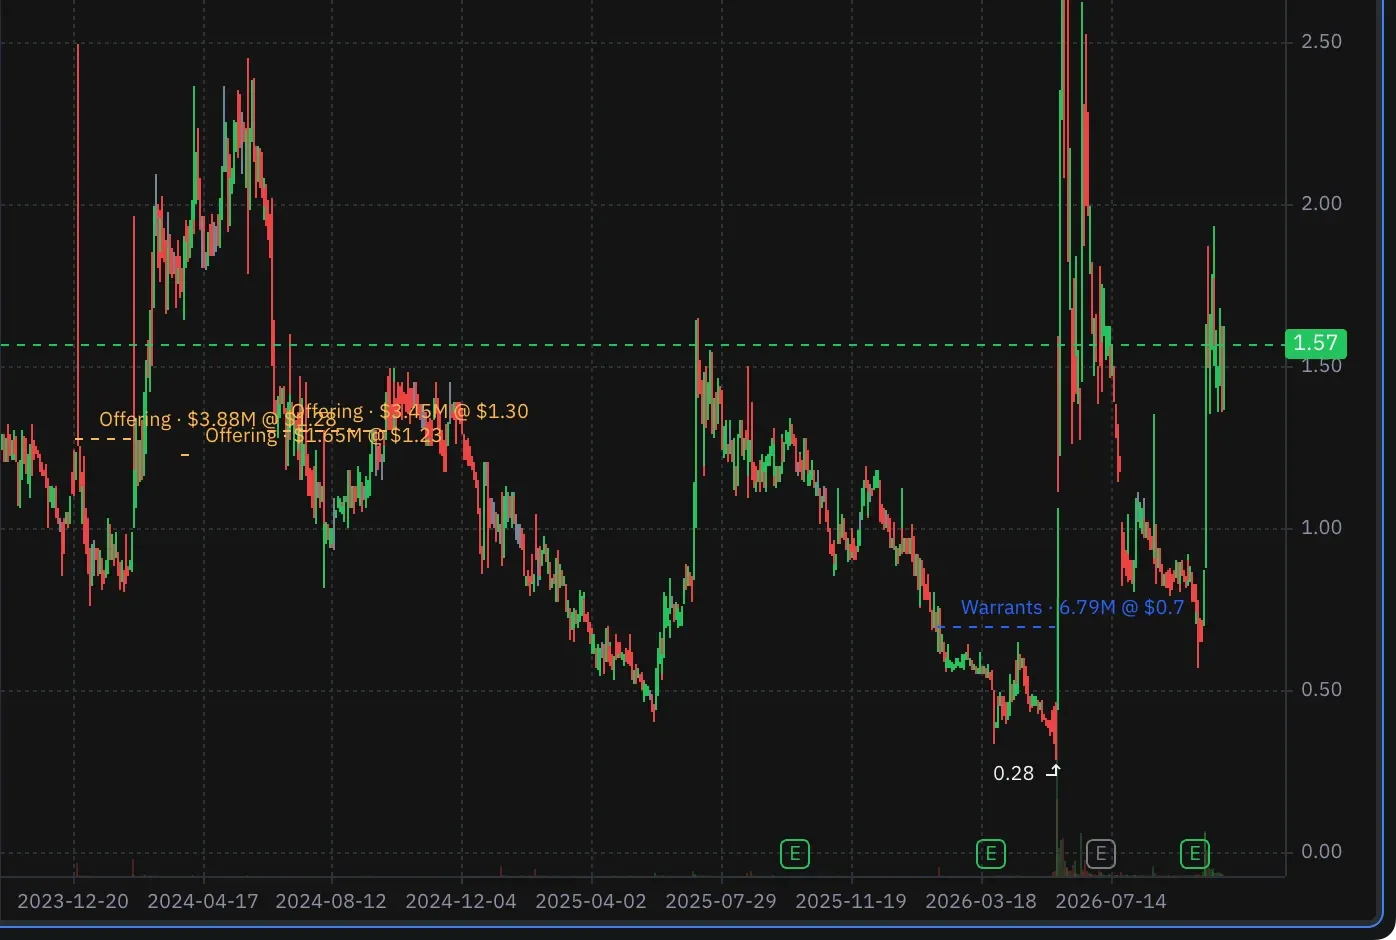
Turn on dilution lines and the daily chart draws warrant strikes and offering prices as price levels. Earnings get a marker on the time axis.
Drawings
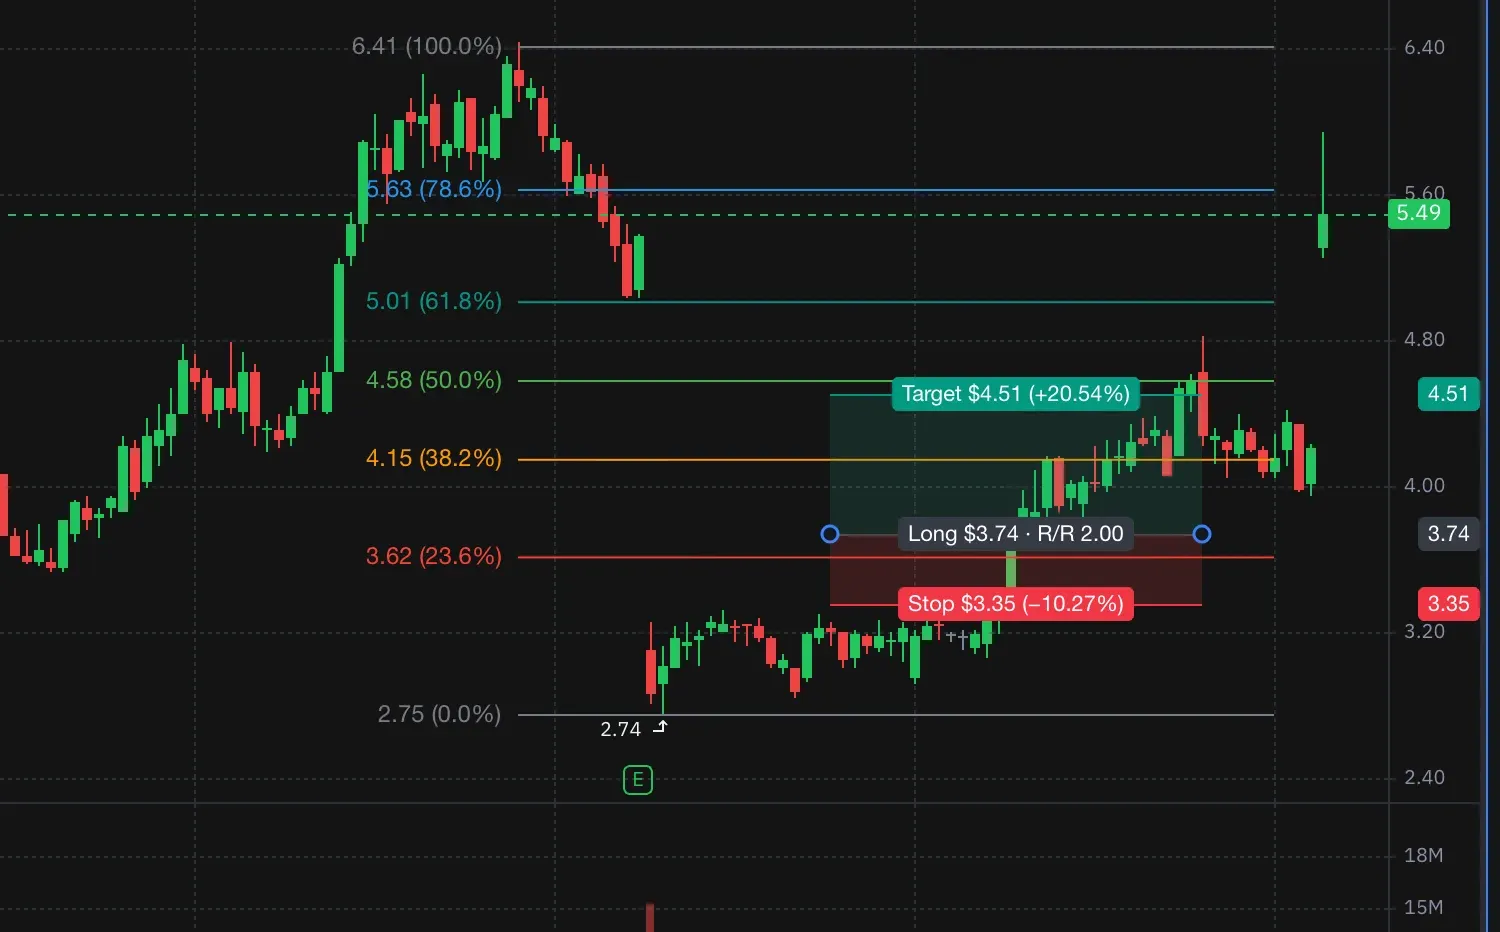
Draw Fibonacci, trend lines, channels and long or short position boxes. A position box shows your target, stop and risk/reward on the chart.
Indicators
Search the indicator picker and star your favorites. Save the setup as a template, and it loads on any chart in the app.
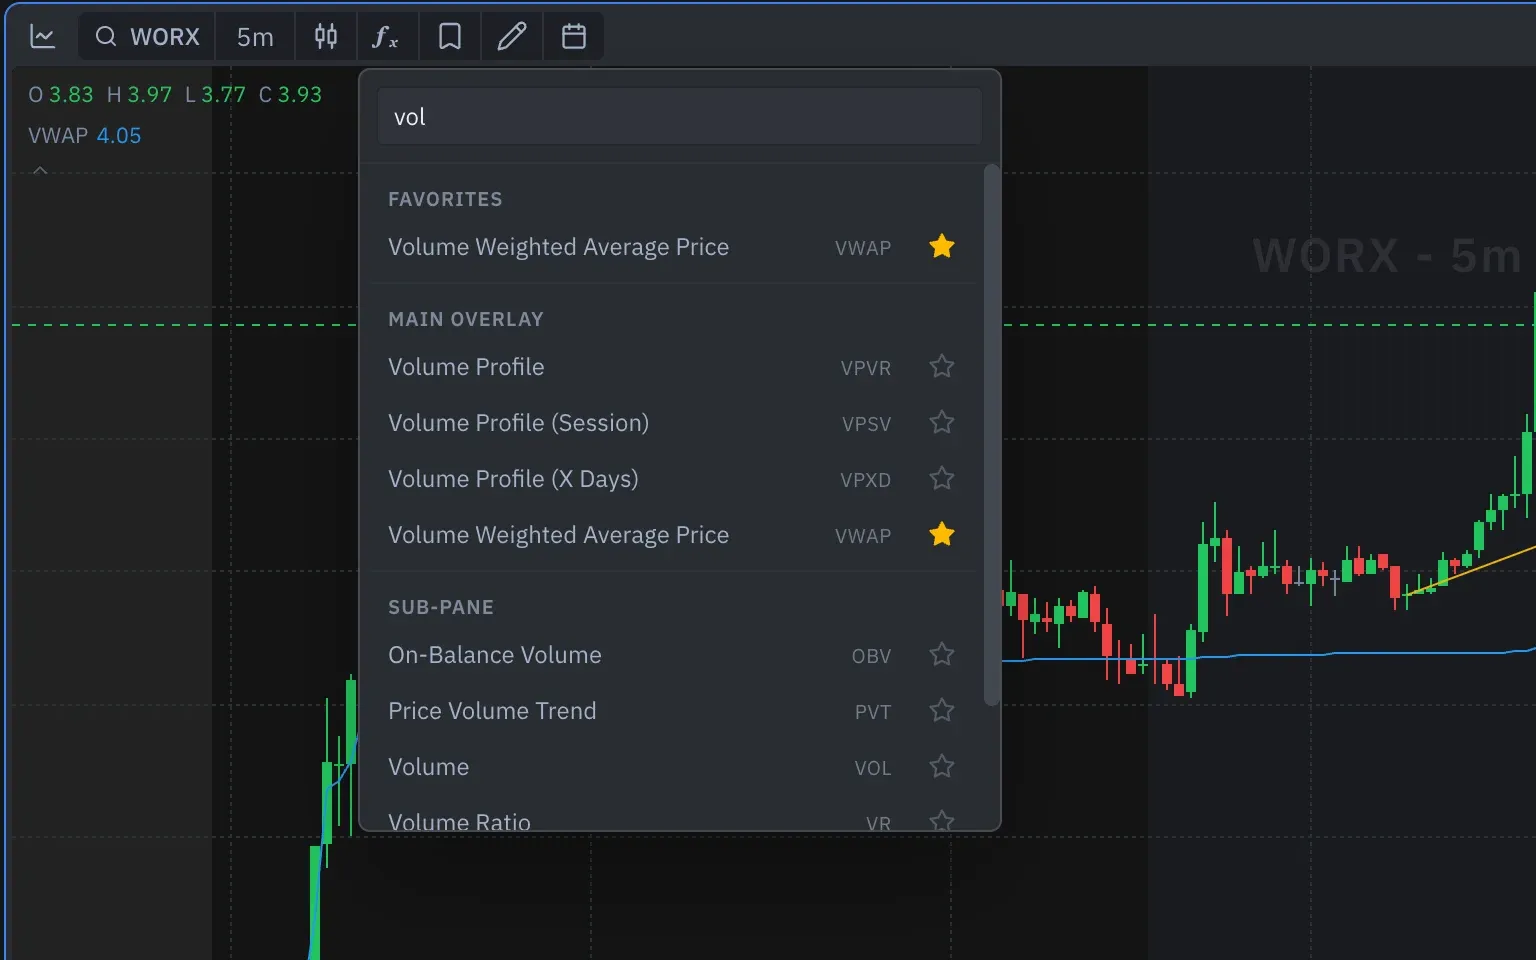
Chart grids
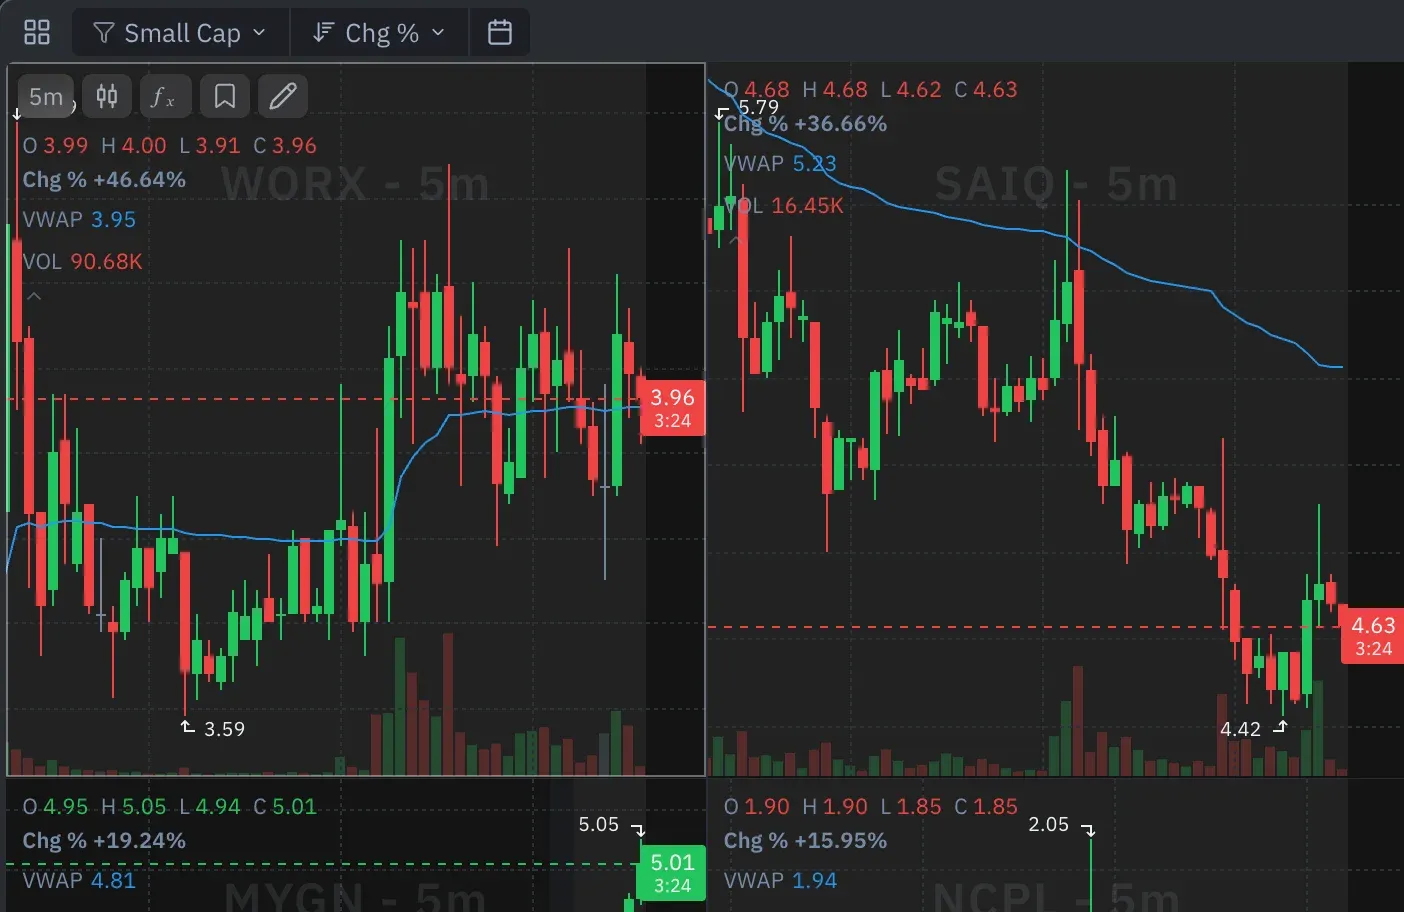
Chart-Scanner turns a live scan into up to nine charts, sorted like the scan. In History, a chart grid pages through every matched day.
Linked charts
Put a chart next to your scanner, watchlist or news, and it follows the ticker you click. Or type over the chart to change the ticker or timeframe.
“Completely customizable, beautiful charts, multi-time frame, SEC filings, SSR, dilution, news & press releases.”
Yes. High-performance charts are unlimited on Basic, Pro, Pro+ and Ultimate. The multi-ticker grids, Chart-Scanner and History's chart grid, are on Pro.
1, 2, 3, 5, 10, 15 and 30 minutes, 1 hour, 4 hours, daily, weekly and monthly. Candles, bars, line, Heikin and TPO (market profile).
Yes. Templates save the chart type and every indicator with its settings, and load on any chart in the app. Drawings save on their own, per ticker.
Yes. Turn on warrant strikes and offering prices in chart settings. Dilution data covers companies under roughly $1B market cap.
Yes. Type letters over a chart to search a ticker, type a timeframe and press Enter to switch, and use Option (Alt) shortcuts to place lines and Fibonacci at your cursor.
Unlimited charts on every plan, linked to your scanner, news and stats. 7-day free trial.