For Systematic Traders
Define your entries, exits, and targets using 1,400+ data columns and 15 years of verified history. Build conviction before ever placing a trade.
Core Features
Define your if-then logic, test it across 15 years, and build conviction before you trade.
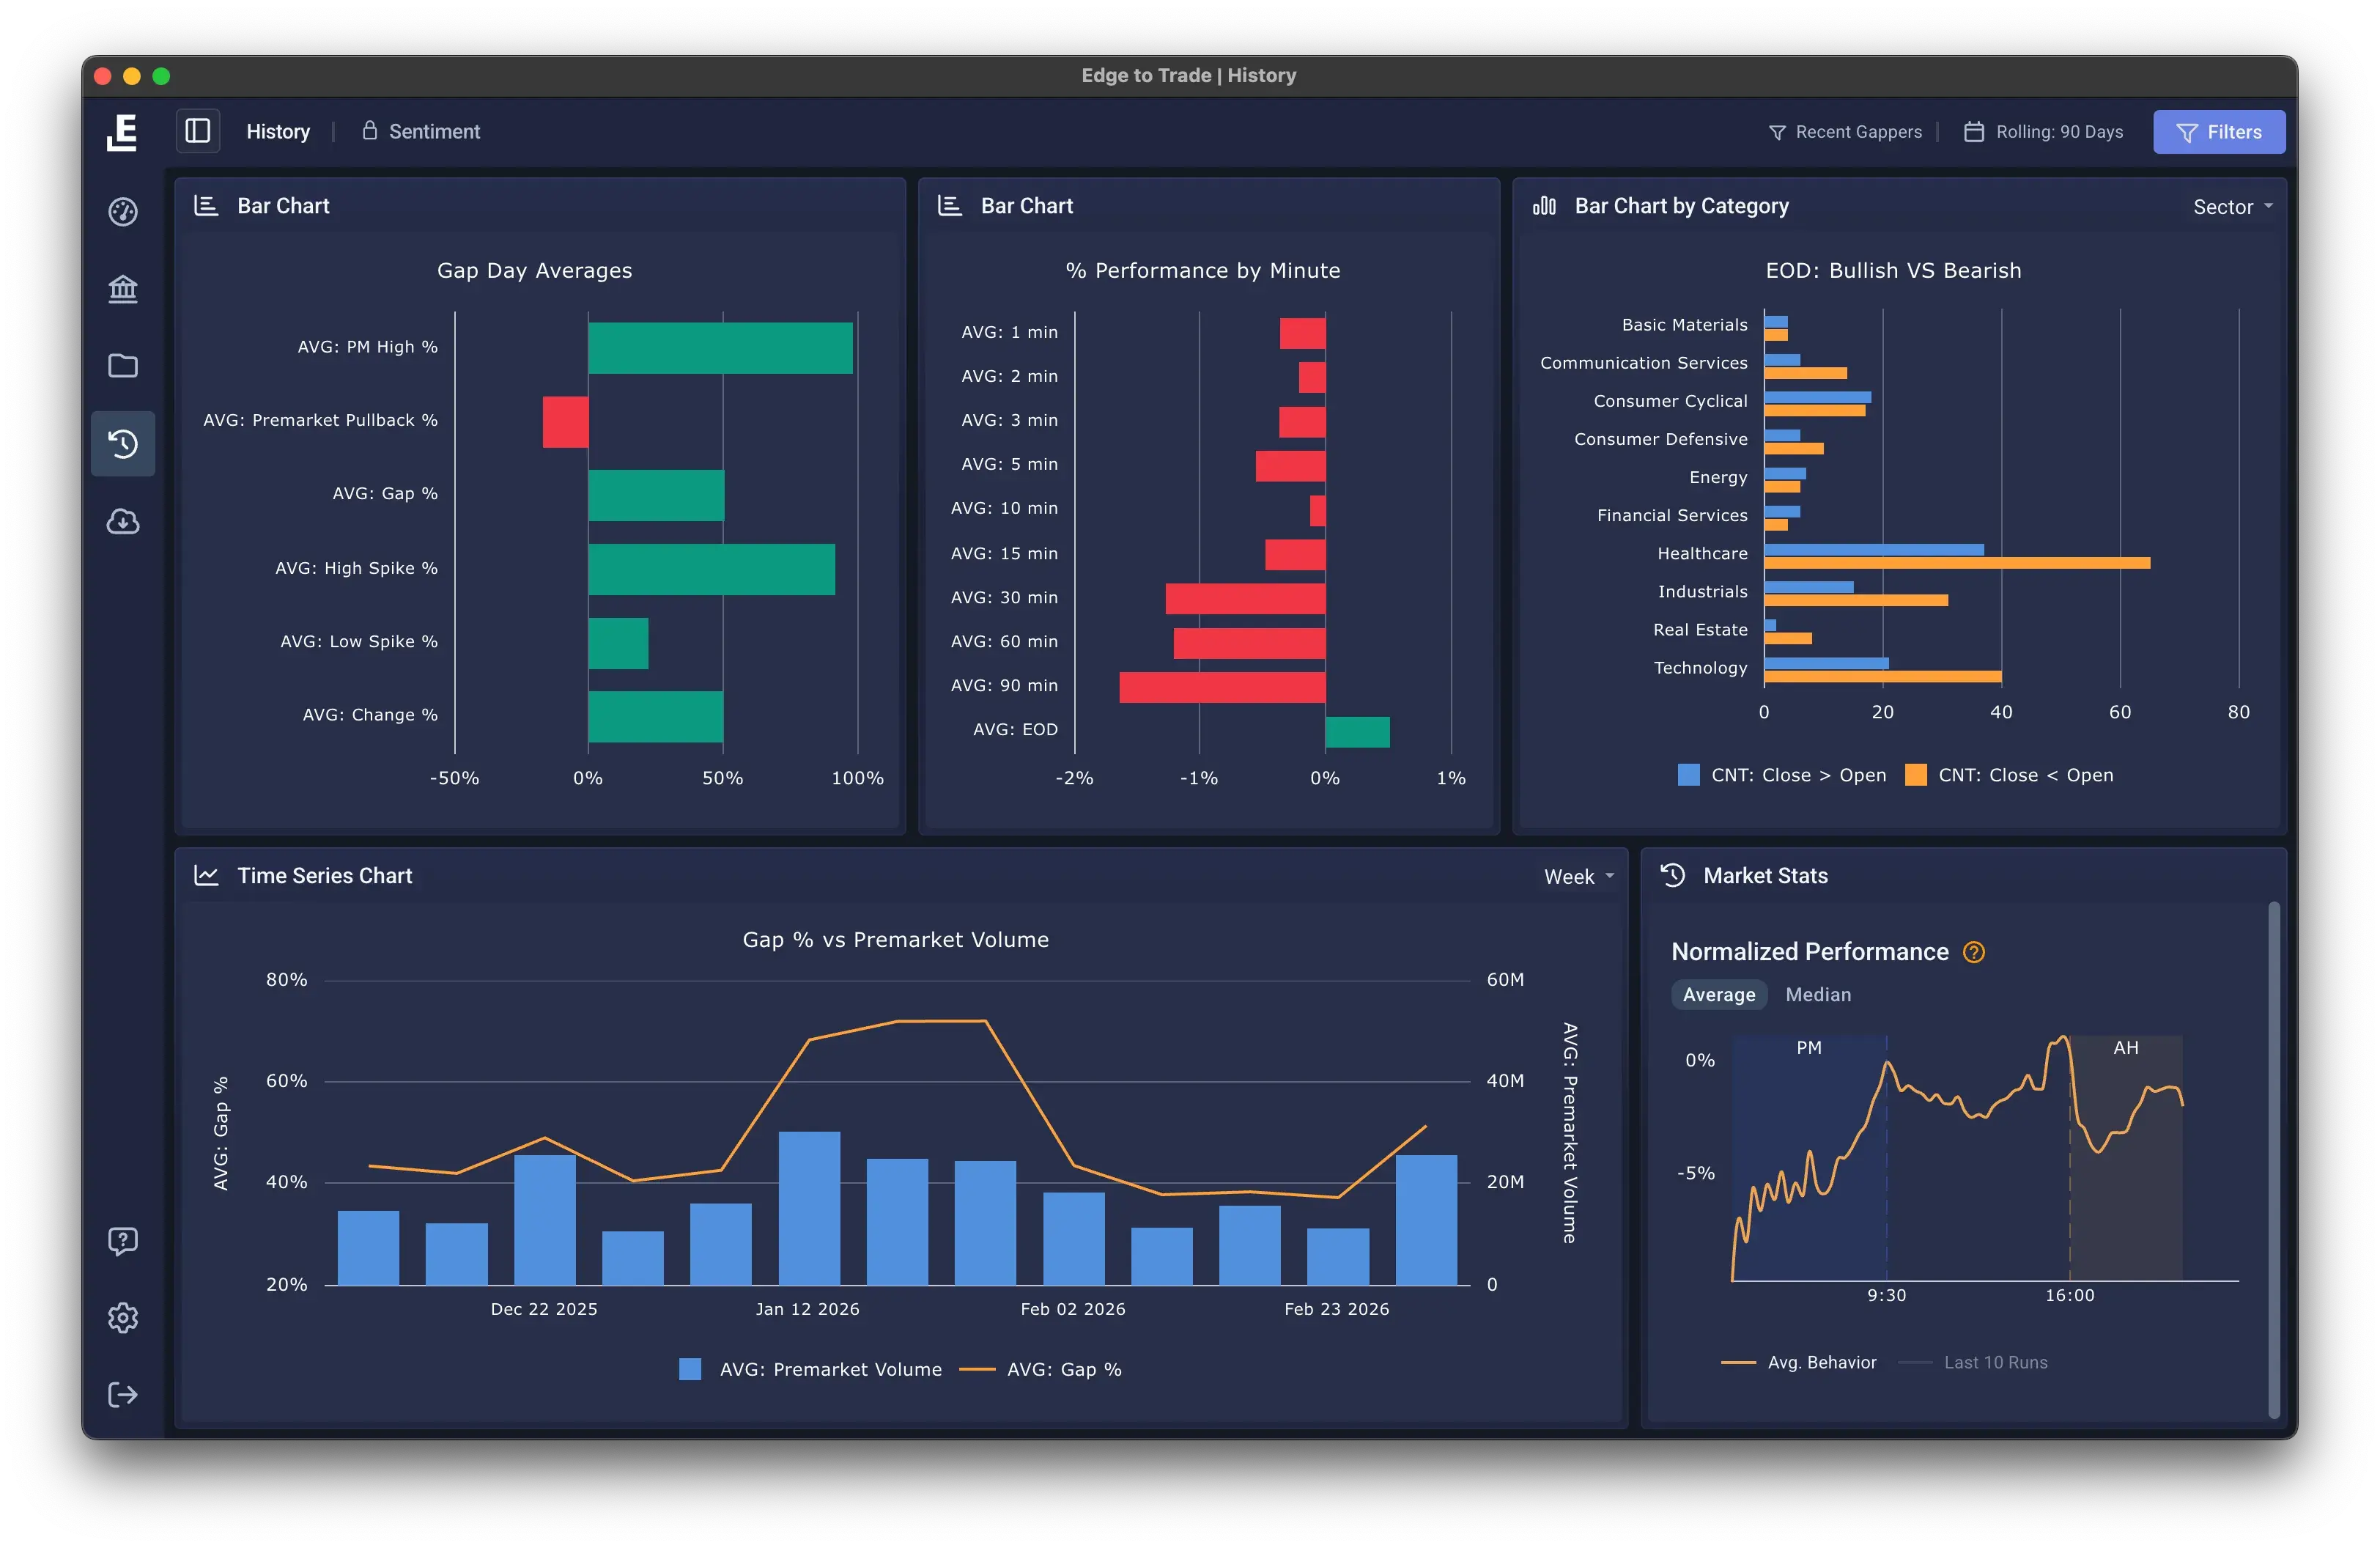
1,400+ columns become filterable conditions. Each variable is a rule in your process.
Test across 5,000+ trading days. Large sample sizes separate signal from noise.
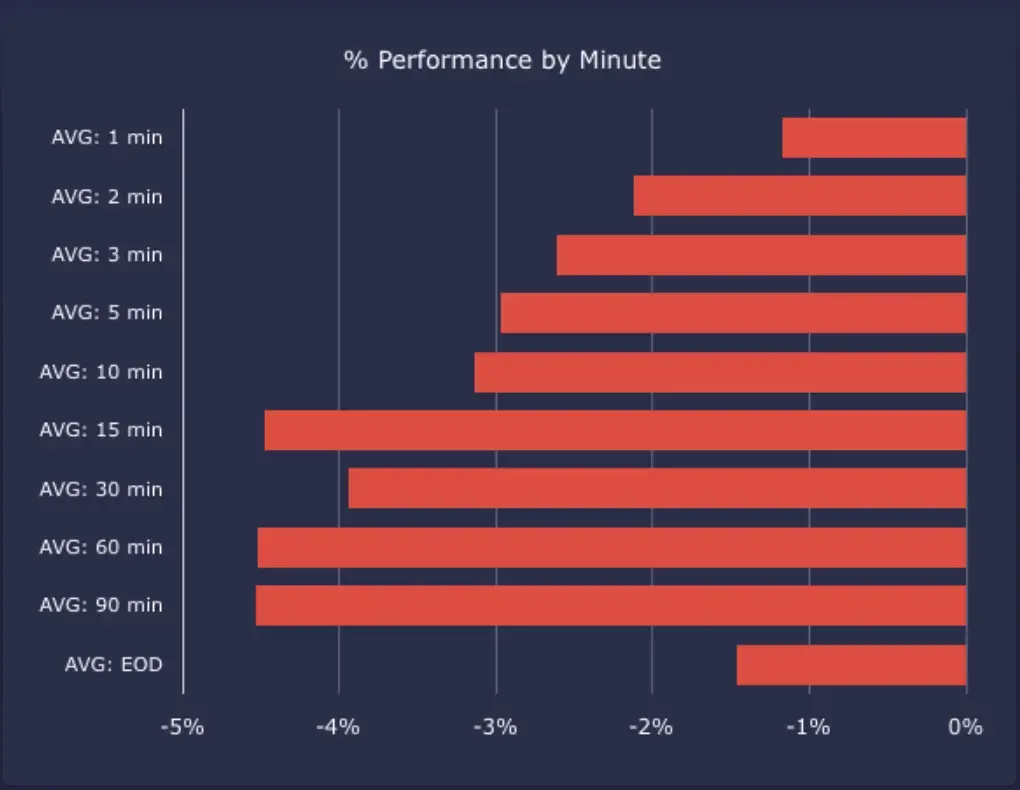
See how your criteria performed historically. Trade with rules, not gut feel.
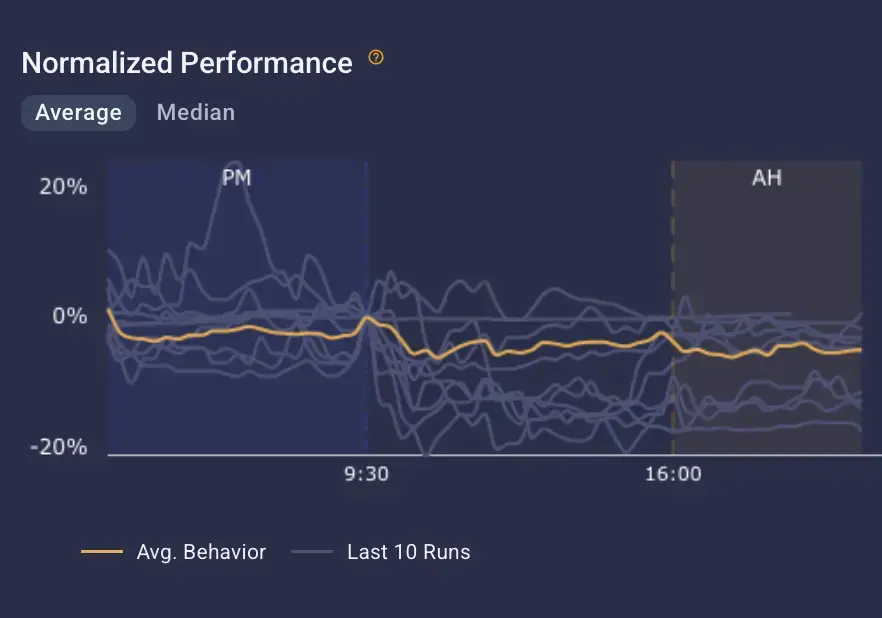
Building a process requires pattern recognition across thousands of setups. Bar charts, scatter plots, and visual layouts let you see how variables relate - so you build conviction from data, not from staring at charts until your eyes give out.

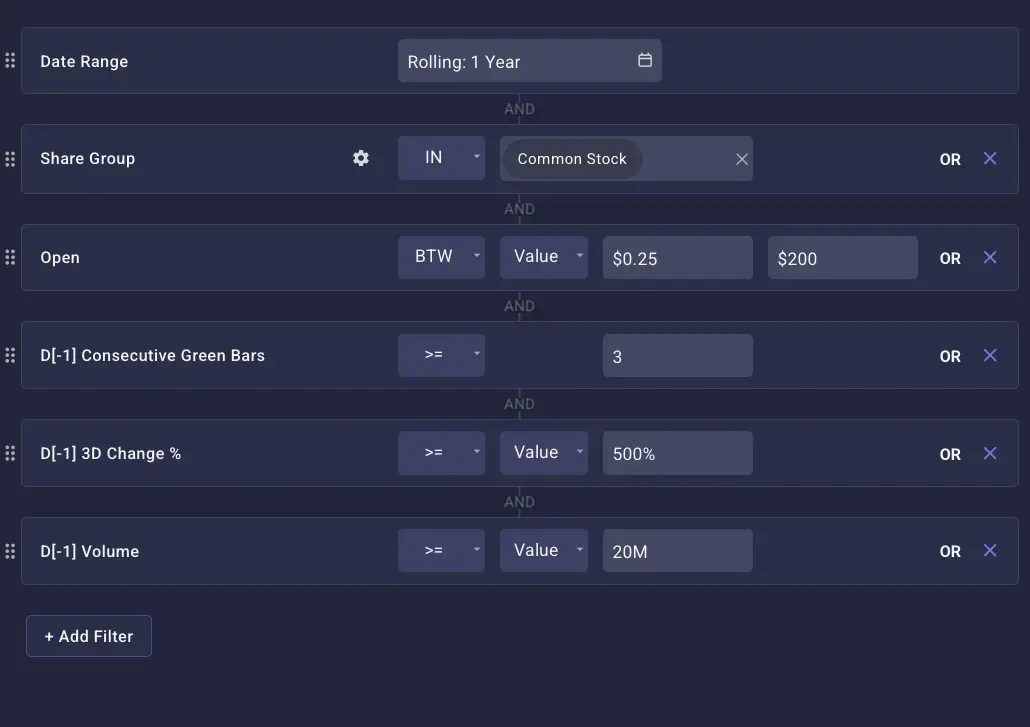
Build your strategy in the research interface, then use the scanner to find exactly what you've validated. Same filters, same data - research to scanning in one place.

Trader Stories
“The stock scanning tools are really customizable, allowing me to filter stocks based on a variety of criteria. The backtesting feature is a standout - it's great for testing strategies on historical data before I put any real money on the line.”
Anthony O.
Active Trader
“So much information it's unreal. This scanner is so easy to use. Personally, I LOVE the gap stats. Has so much information to have the confidence to execute a trade on the short side.”
Zach E.
Short Seller
Everything you need to know about our plans and platform.
Over 1,400 columns covering float, share structure, volume metrics, technical indicators, earnings data, institutional holdings, insider activity, SEC filings, and more. Every column is filterable and usable in custom expressions.
15 years - over 5,000 trading days covering multiple bull markets, bear markets, and everything in between. Large sample sizes so your conclusions are statistically meaningful.
Custom expressions let you build your own metrics using formulas - sum, average, median, and more - applied across the full dataset. They're expression-based, not code-based, so you don't need programming skills.
Yes. Pro+ plans include CSV export. But most systematic traders find they don't need to - the in-platform research interface handles charts, calculations, and comparisons directly.
The criteria you validate in the research interface use the same filters and data definitions as the scanner. So once you've built conviction around a set of rules, you can apply those same filters to find current setups that match.
1,400+ columns, 15 years of verified data, and a research interface built for systematic traders.

