History

See how your setup played out. 15 years deep.

Filter 15 years of data to the days that match your setup, then see how they played out, record by record and hour by hour.

On every planBasic: 6 months. Pro: 14 years and custom metricsCompare plans
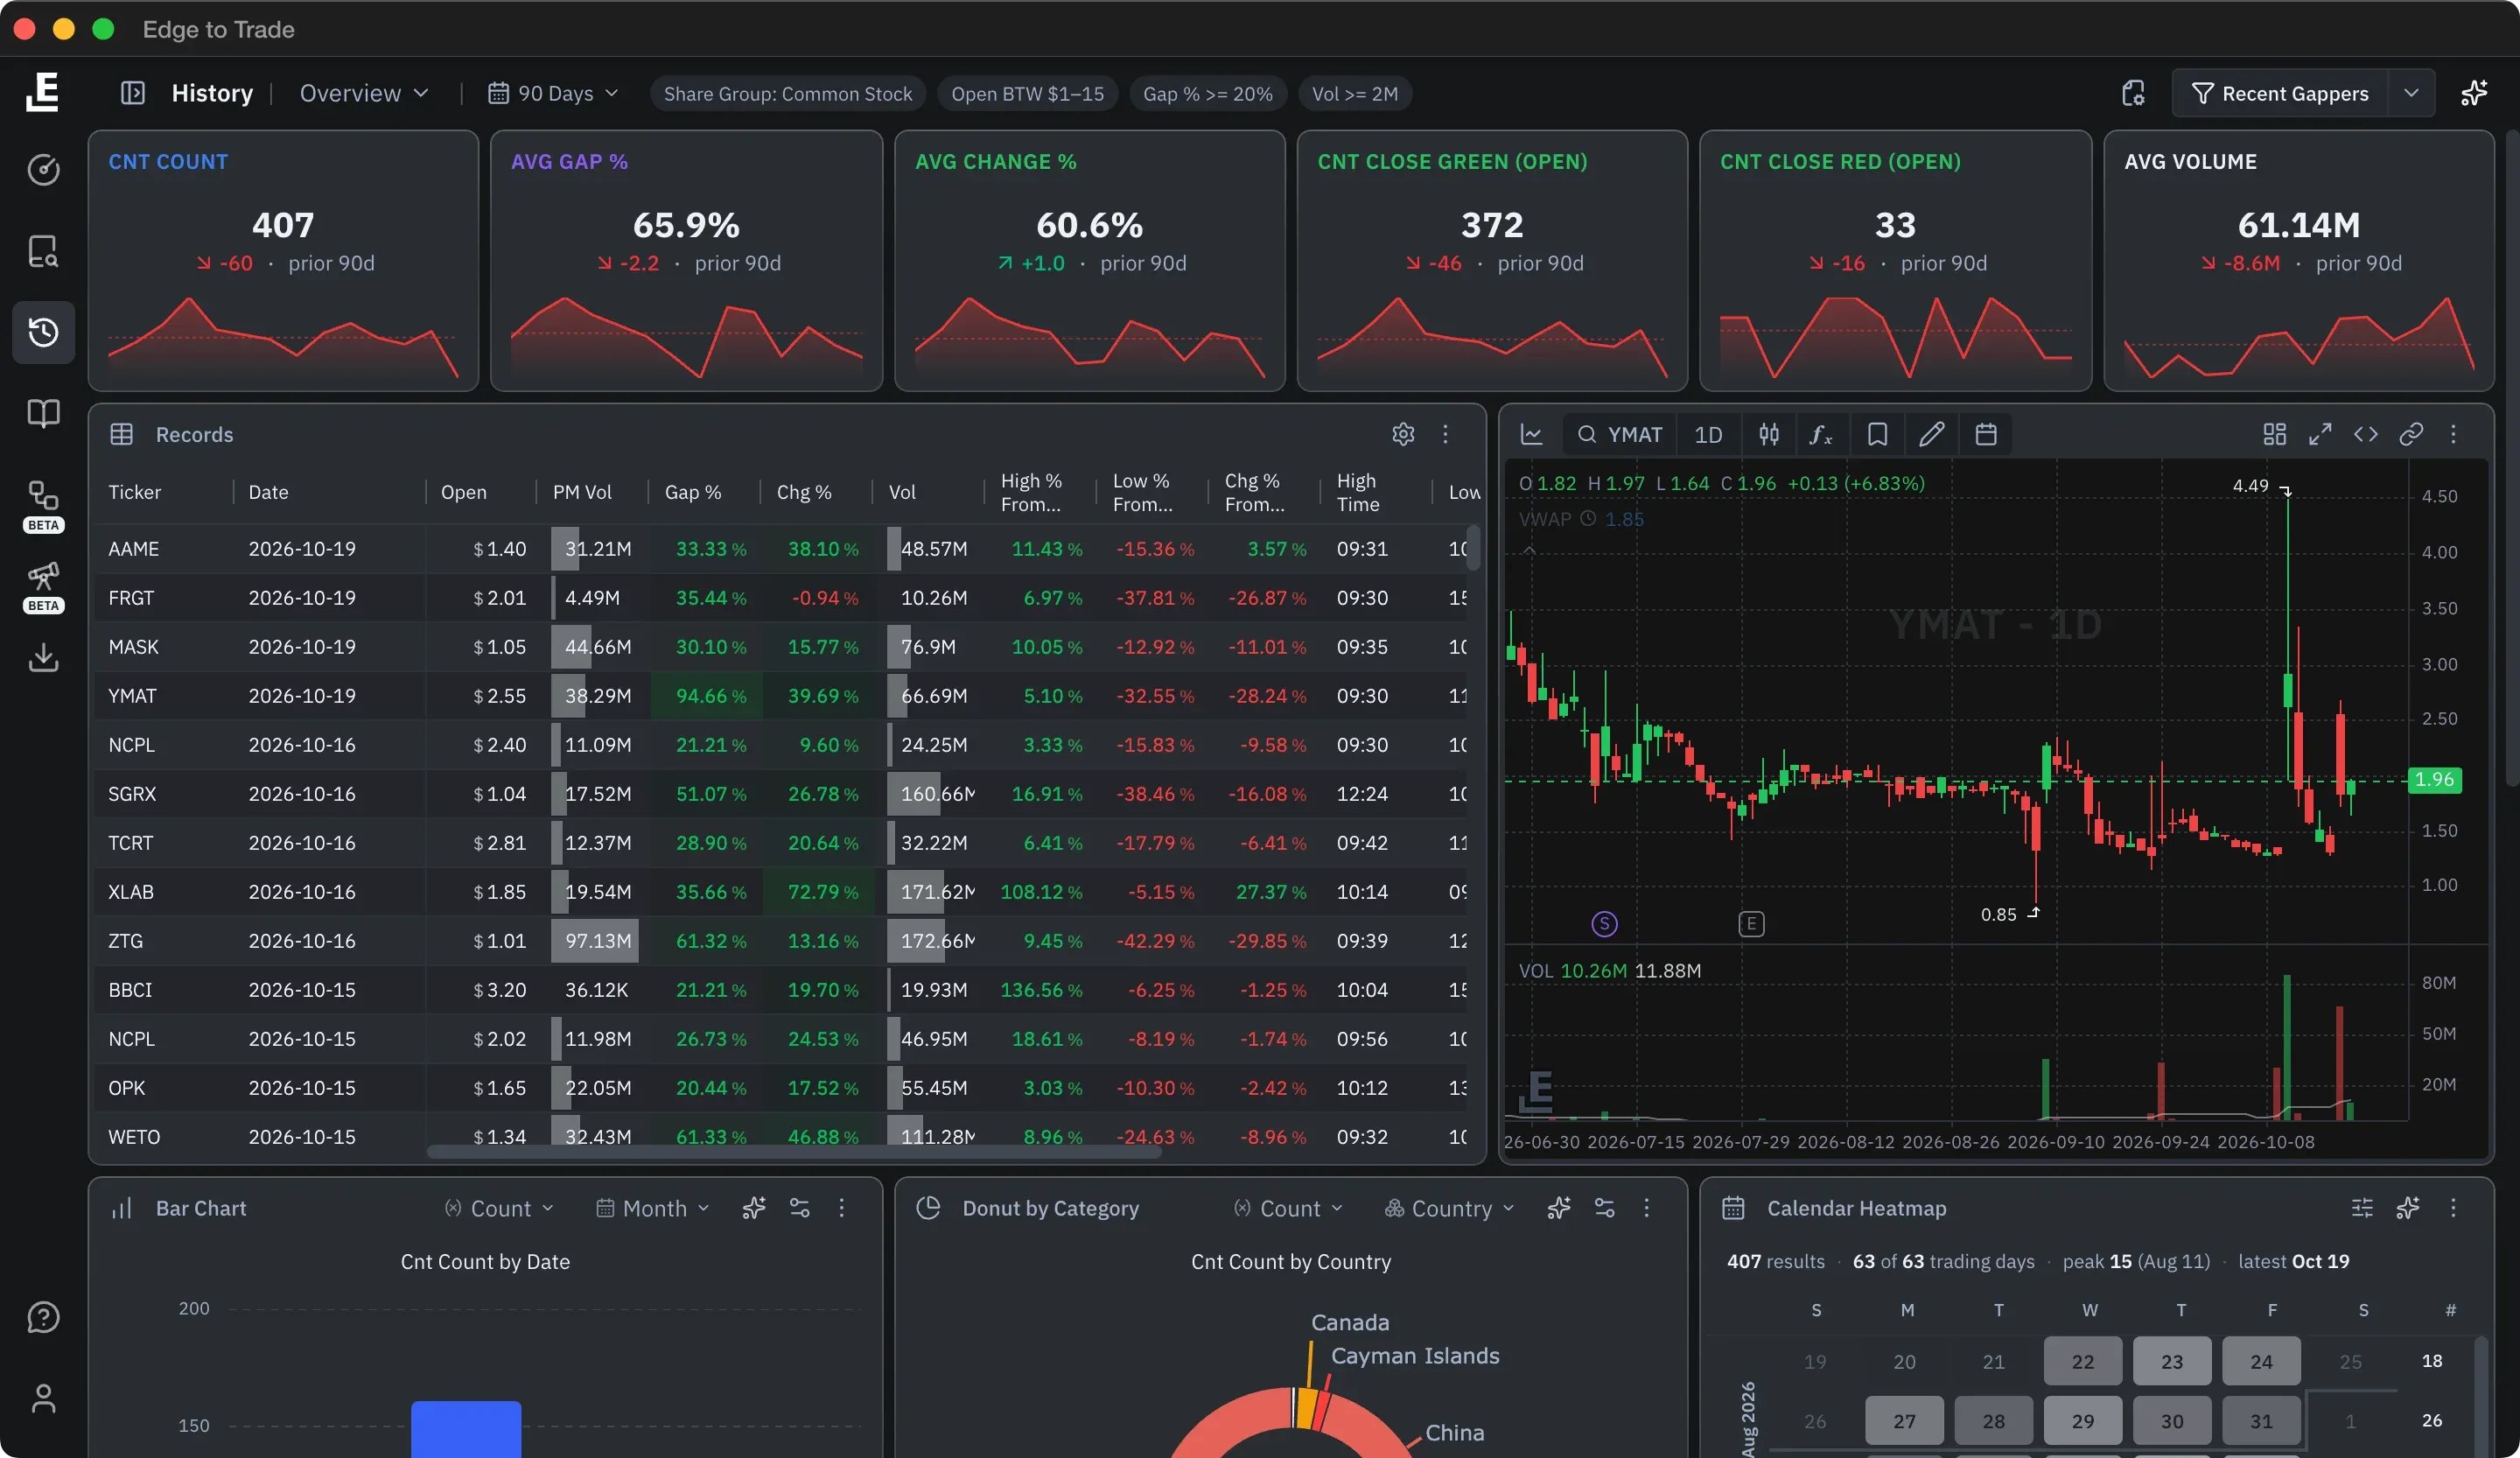
History Overview preset on Recent Gappers over 90 days: six scorecards with sparklines, the Records grid beside a linked daily chart, and Bar Chart, Donut and Calendar Heatmap panels

Custom metricsOnly on ETT

Track the number nobody else tracks

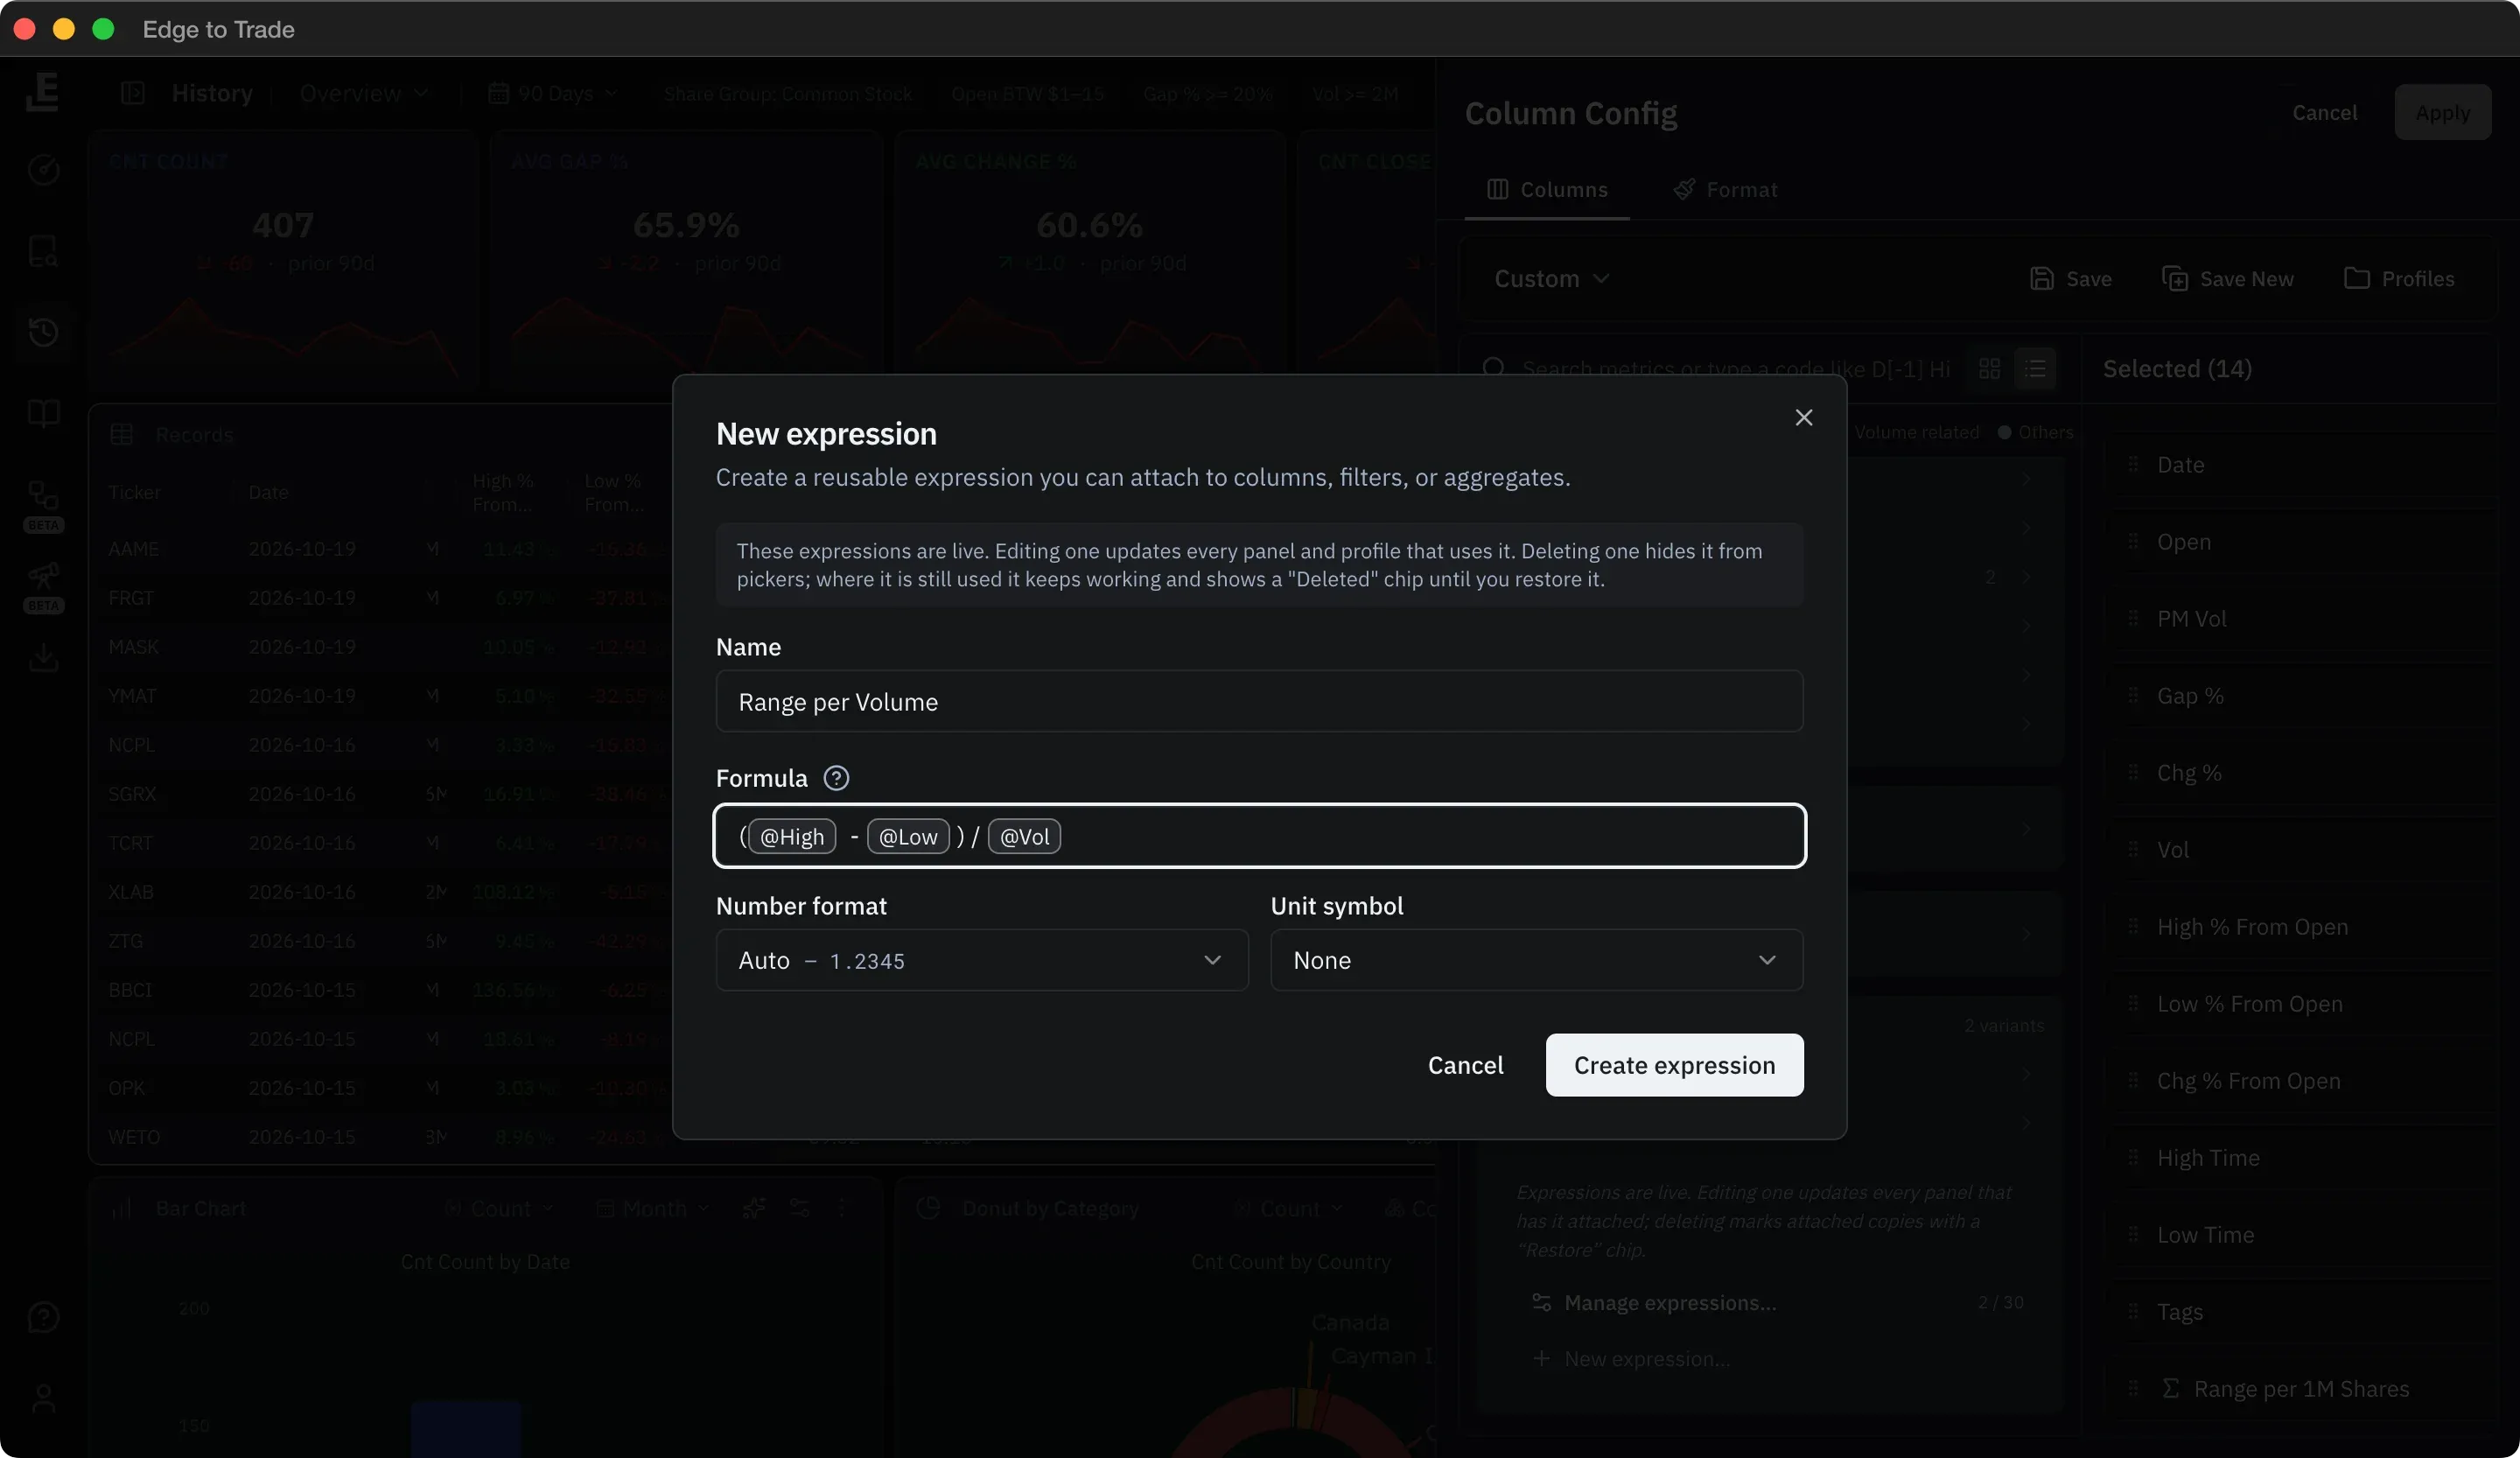
Write a formula once, like (High − Low) / Volume, and use it as a column, a filter and a stat anywhere in History.

New expression dialog in History: a Range per Volume formula, (High − Low) / Vol, built from column chips, over the Column Config with a Σ custom column selected

Filters

Start from the days that match

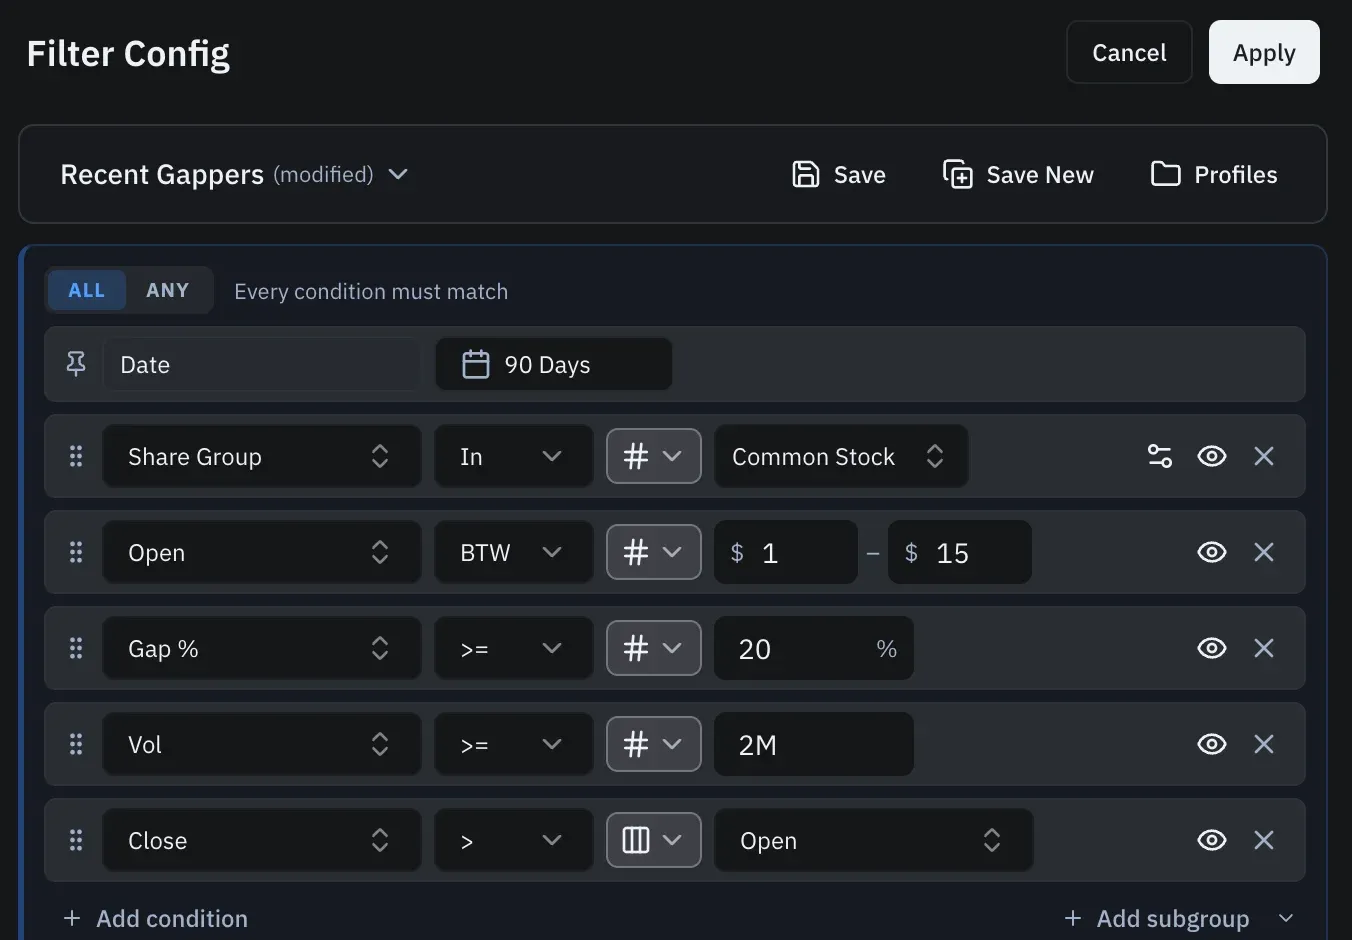
Load a built-in profile like Recent Gappers, or build your own from 1,400+ columns. Then set how far back to look.

  • Morning Runners, Day 2 Plays, Stocks with Halts and more
  • 7 days back, or up to 14 years on Pro
  • Compare columns, like Close above Open
History Filter Config on the Recent Gappers profile: a pinned 90-day date, Common Stock, open between $1 and $15, gap of 20% or more, volume of 2M or more, and a Close above Open column compare

Find similar days

One interesting day becomes a study

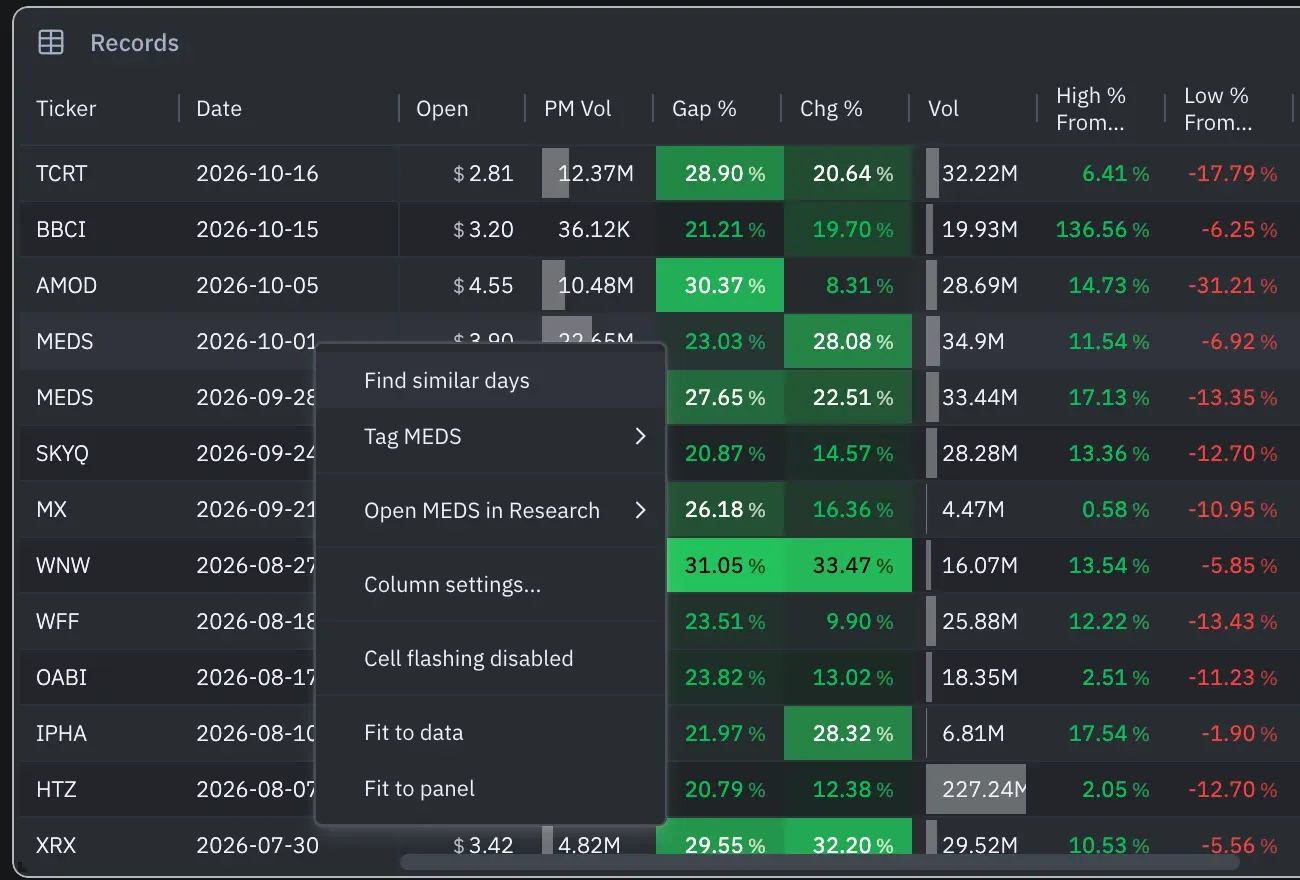
Right-click any record and choose Find similar days. History builds a filter around that day's numbers, like gap, change and close.

  • Matched on gap, change, float, volume and more
  • Each range becomes a filter you can widen or drop
  • Or tag the day, or open the ticker in Research
History Records grid with the right-click menu open on a MEDS row: Find similar days, Tag MEDS, Open MEDS in Research, column settings and fit options

Gap statsOnly on ETT

See what it did after every past gap

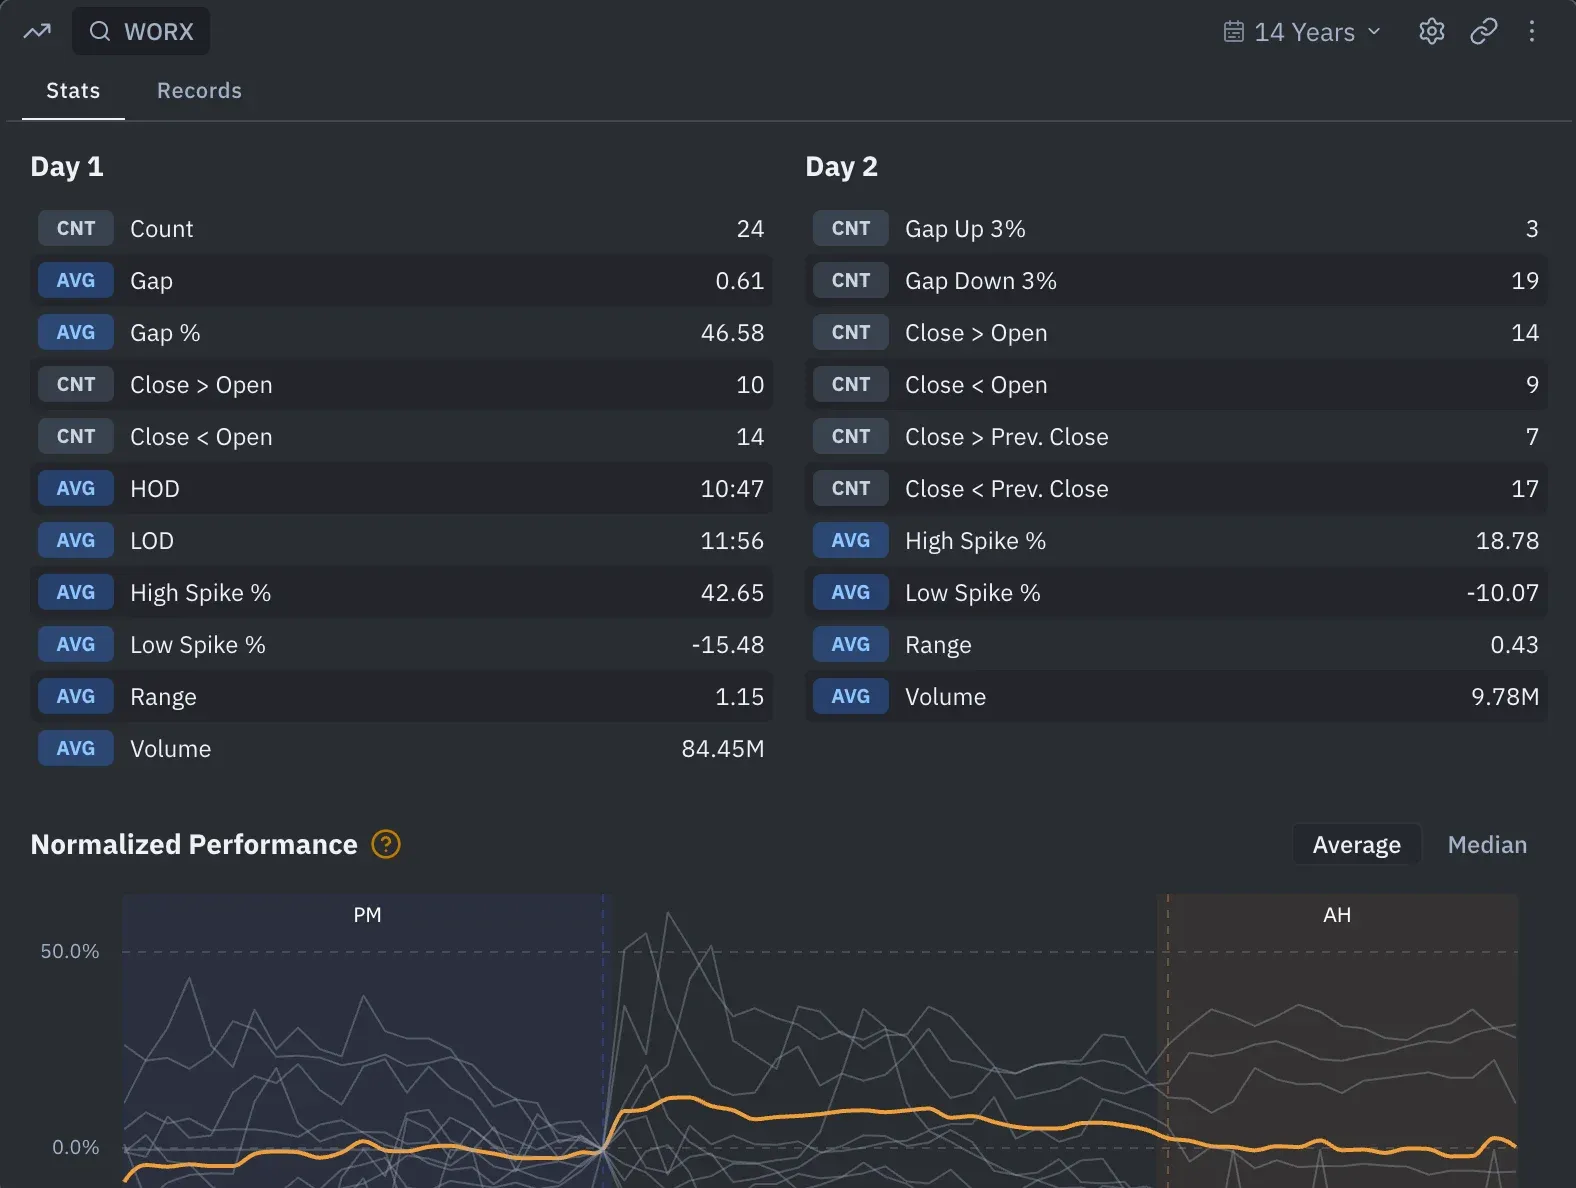
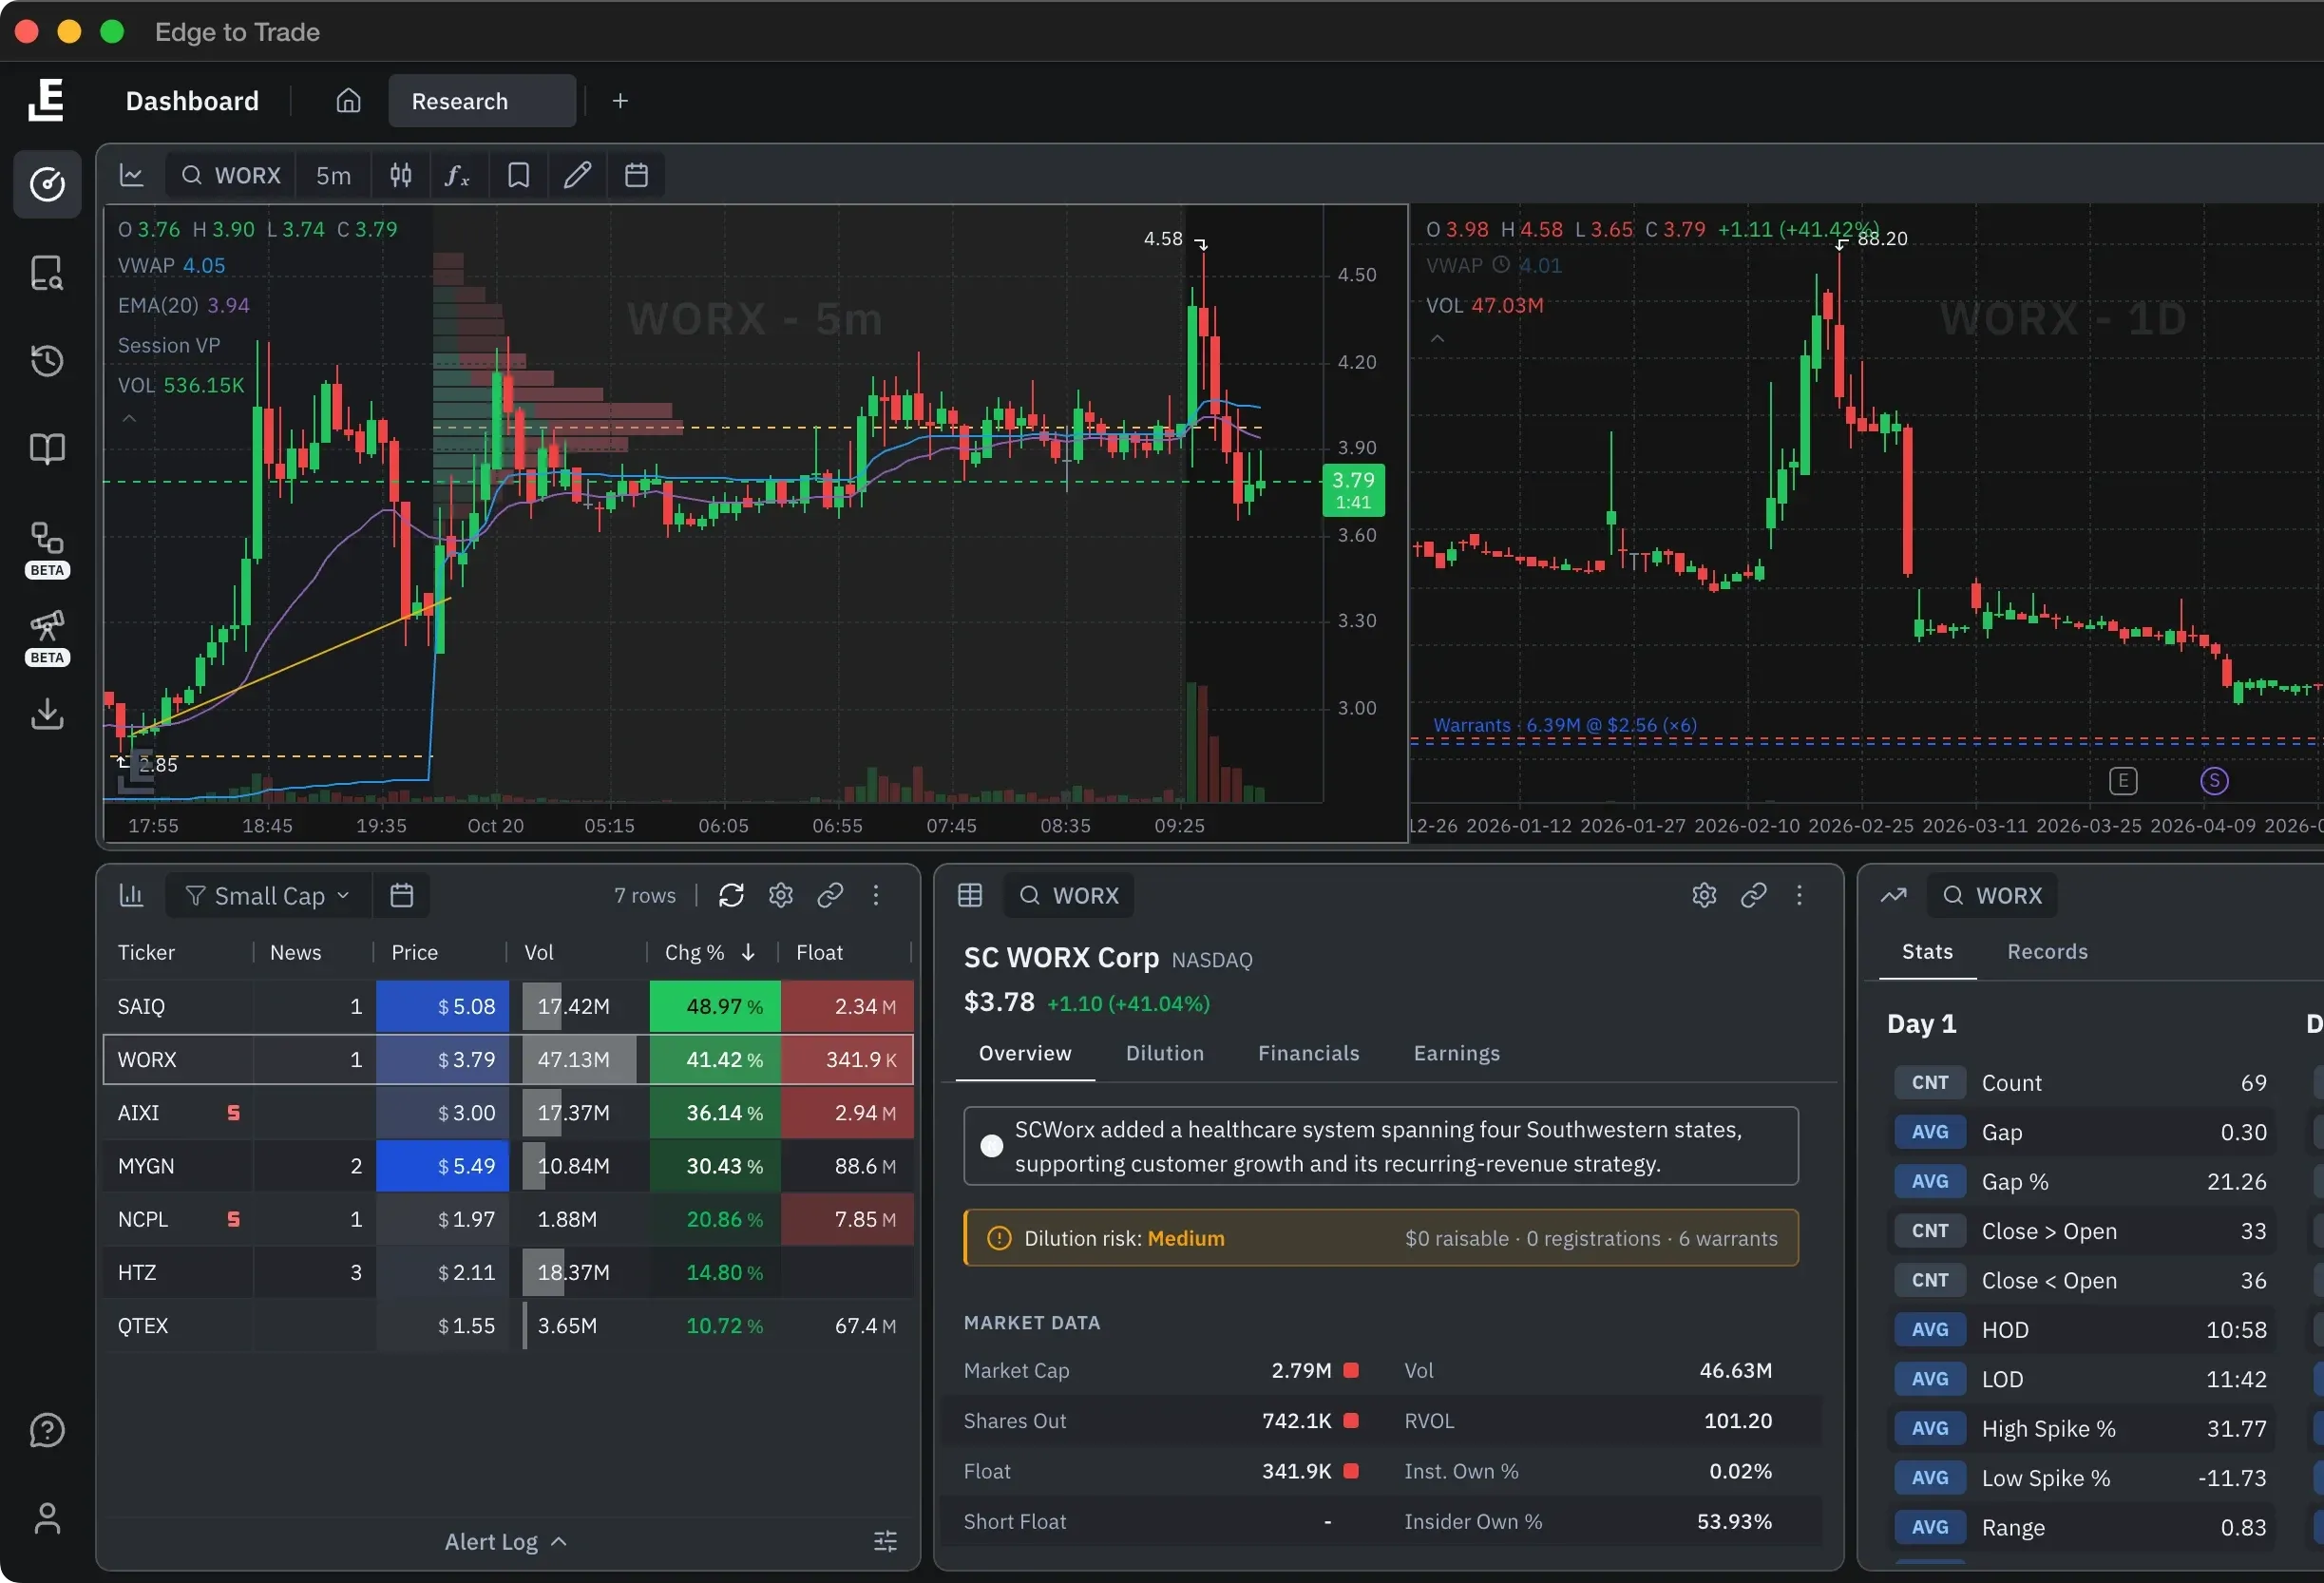
Ticker Stats counts every time this name gapped like today, then shows what Day 1 and Day 2 did next.

  • Presets like Gap 20%+ on Basic, your own on Pro
  • High and low of day times, spikes and range
  • The average path, with pre-market and after-hours shaded
Ticker Stats on WORX over 14 years: Day 1 and Day 2 counts and averages (gap, close against open, high and low of day times, spikes, range, volume) above the normalized performance curve with pre-market and after-hours shading

Flow GraphOnly on ETT

Follow the set from gap to close

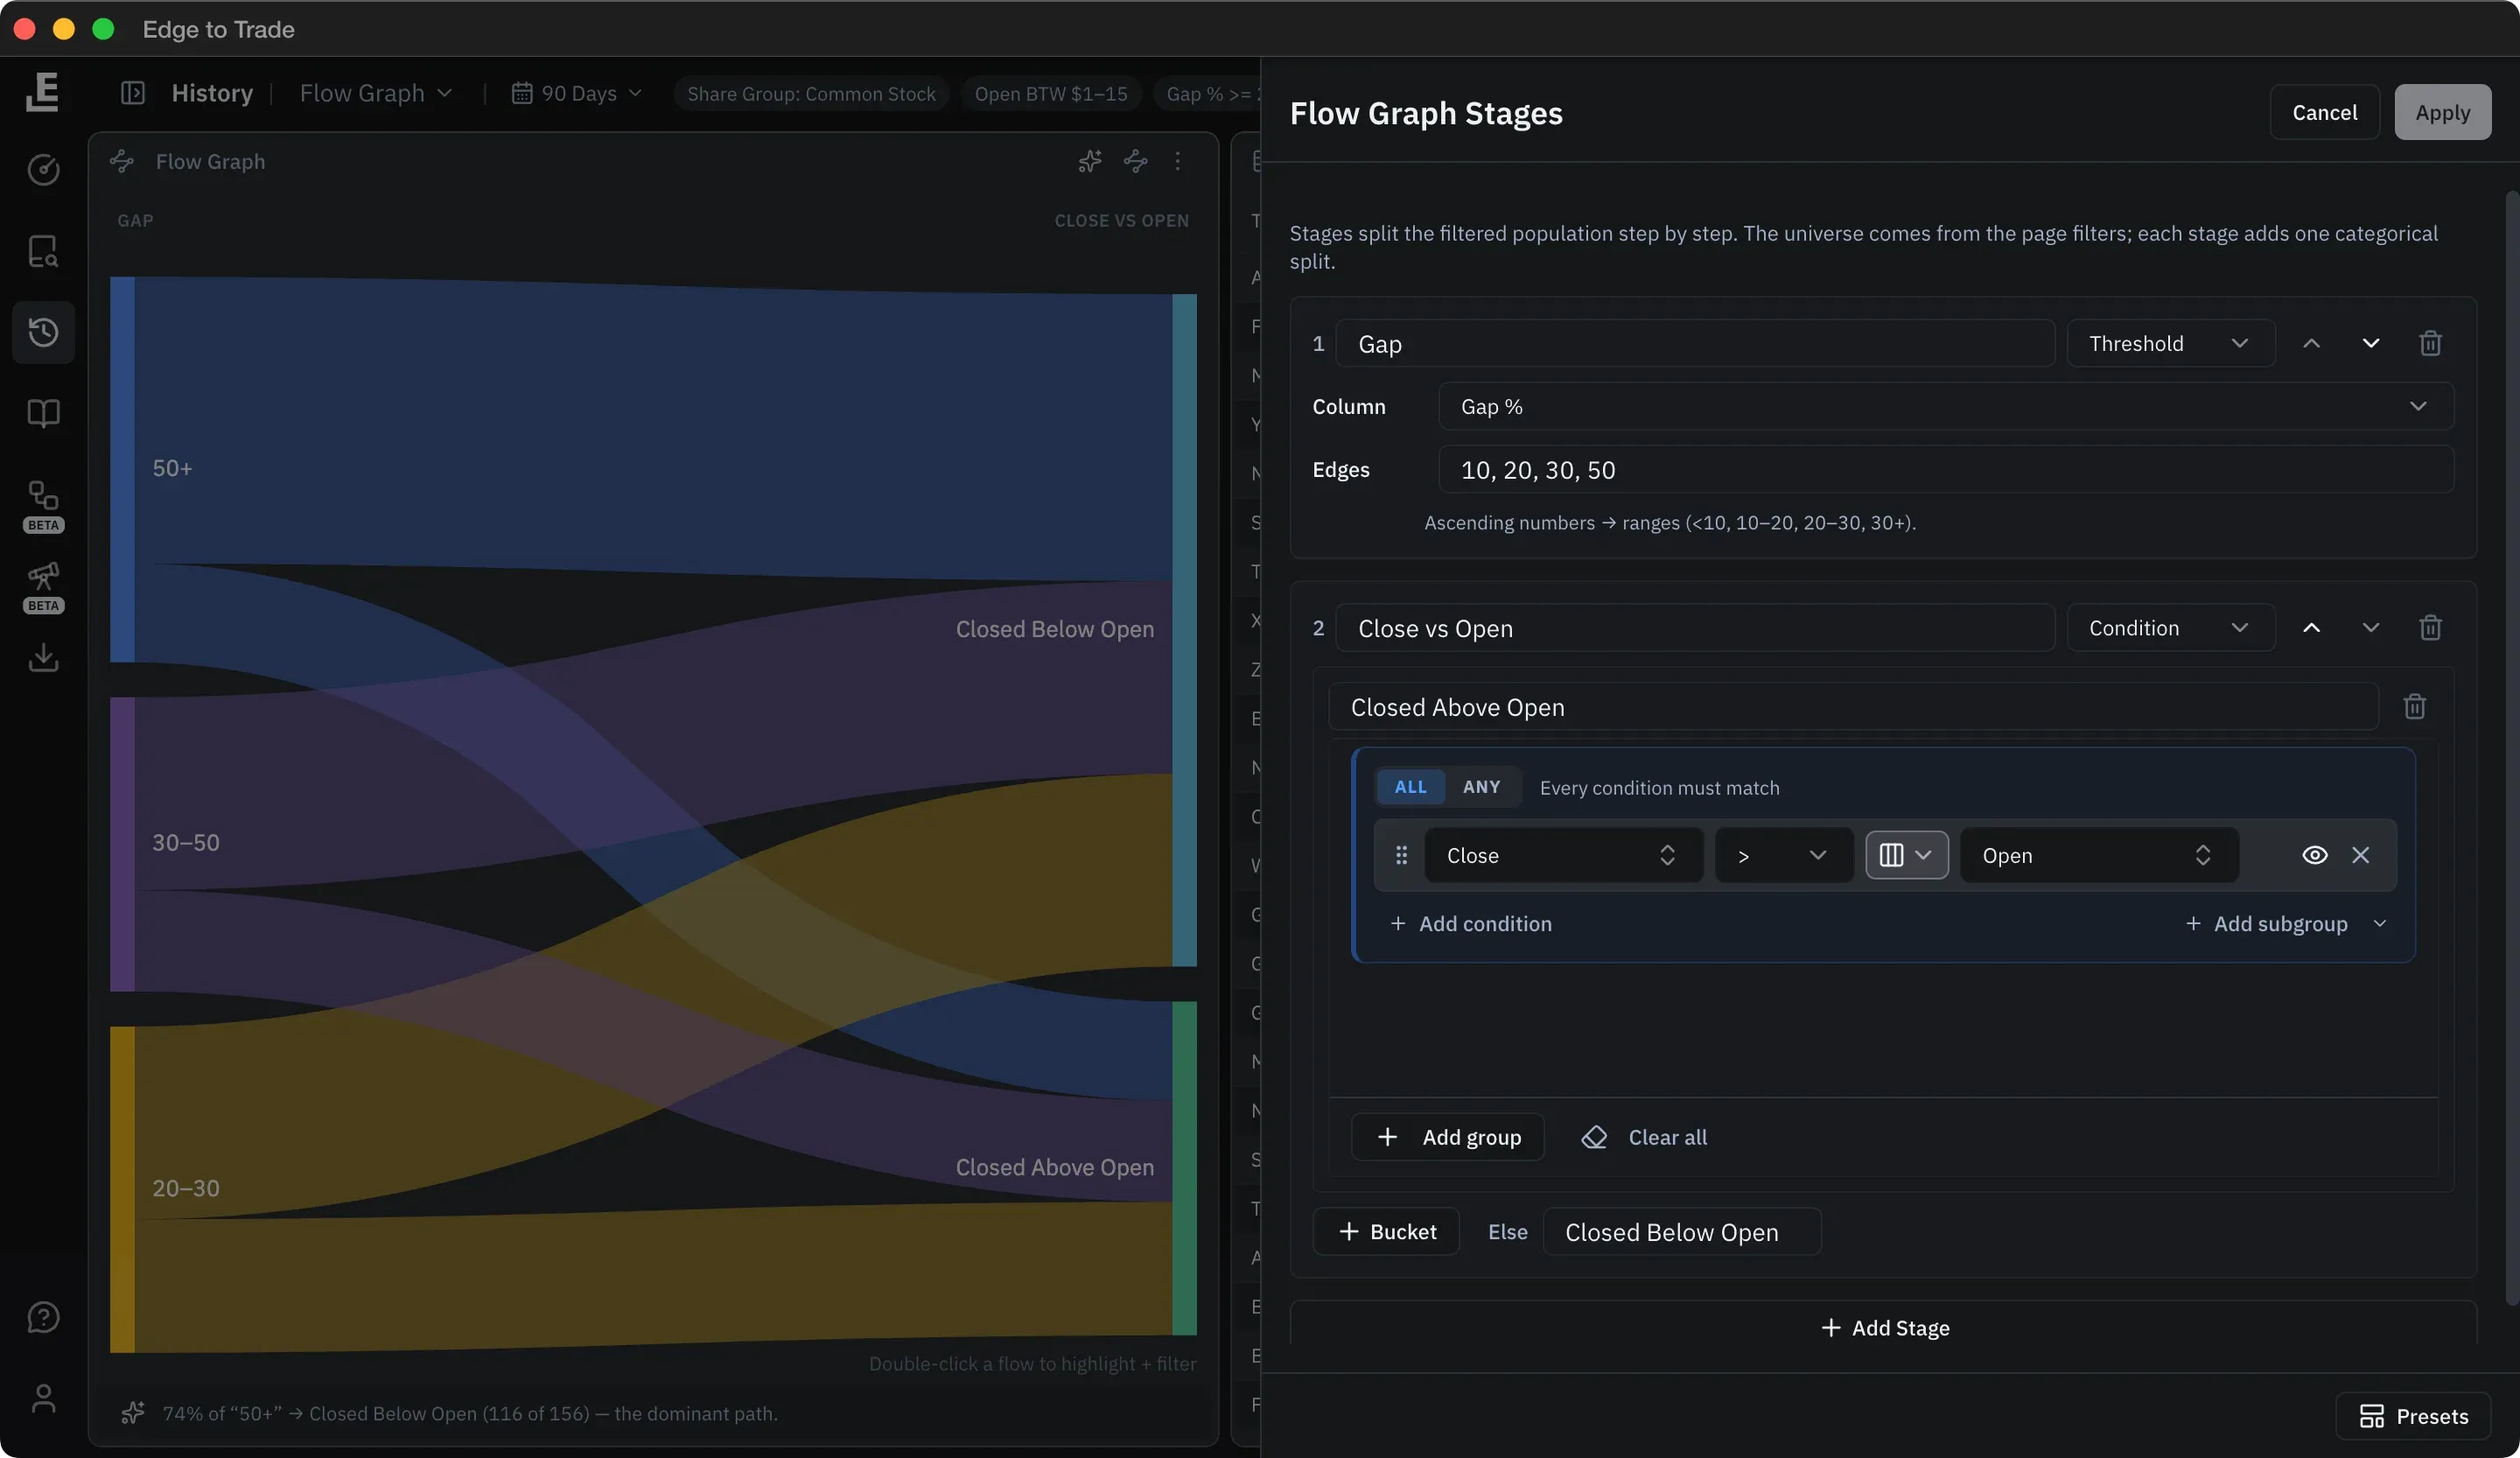
Split the matched days stage by stage and see where each group went. Double-click a flow to highlight and filter it.

Flow Graph splitting Recent Gappers by gap tier (20–30%, 30–50%, 50%+) into closed above or below the open, with the Stages editor open beside it
  1. Split by gapPro

    Edges at 10, 20, 30 and 50 turn Gap % into tiers.

  2. Then by the close

    A second stage sorts each tier: closed above or below the open.

  3. Every path, sized

    Each band's width is its share of the matched days.

  4. The answer in words

    A footer names the dominant path, with its count.

Panels & presets

Look at the same days every way

Records, charts, scorecards, price action curves, timing, calendars, heatmaps, scatter and more: 18 panel types to arrange your way. Or start from the Overview, General, Sentiment or Charting & Tags preset.

  • The average intraday path, by day, week, month or year
  • When the high and low of day usually form
  • Your own layouts: one on Pro, unlimited on Pro+

“Gap stats, showing of charts from each gap, filings, graphical views of everything you can imagine.”

CarlfredTrader

Frequently asked questions

The dataset covers 15 years. Pro and up can query 14 years back; Basic covers the last 6 months.

Yes. Built-in profiles cover intraday movers, morning runners, day-2 continuations, large caps and halted stocks, and you can filter on any of 1,400+ columns.

Yes. Right-click any record and choose Find similar days. History builds a filter around that day's numbers, like gap, change and close.

Yes. Float, shares outstanding and market cap are recorded per day. Short interest is the latest exchange report only, with no history.

No. Custom expressions are formulas, not code. For the raw data, Pro+ exports up to 4,000 rows per CSV from your saved History profiles.

Know how it played out before you trade

Start from a preset layout with 15 years of data behind it. 7-day free trial.