
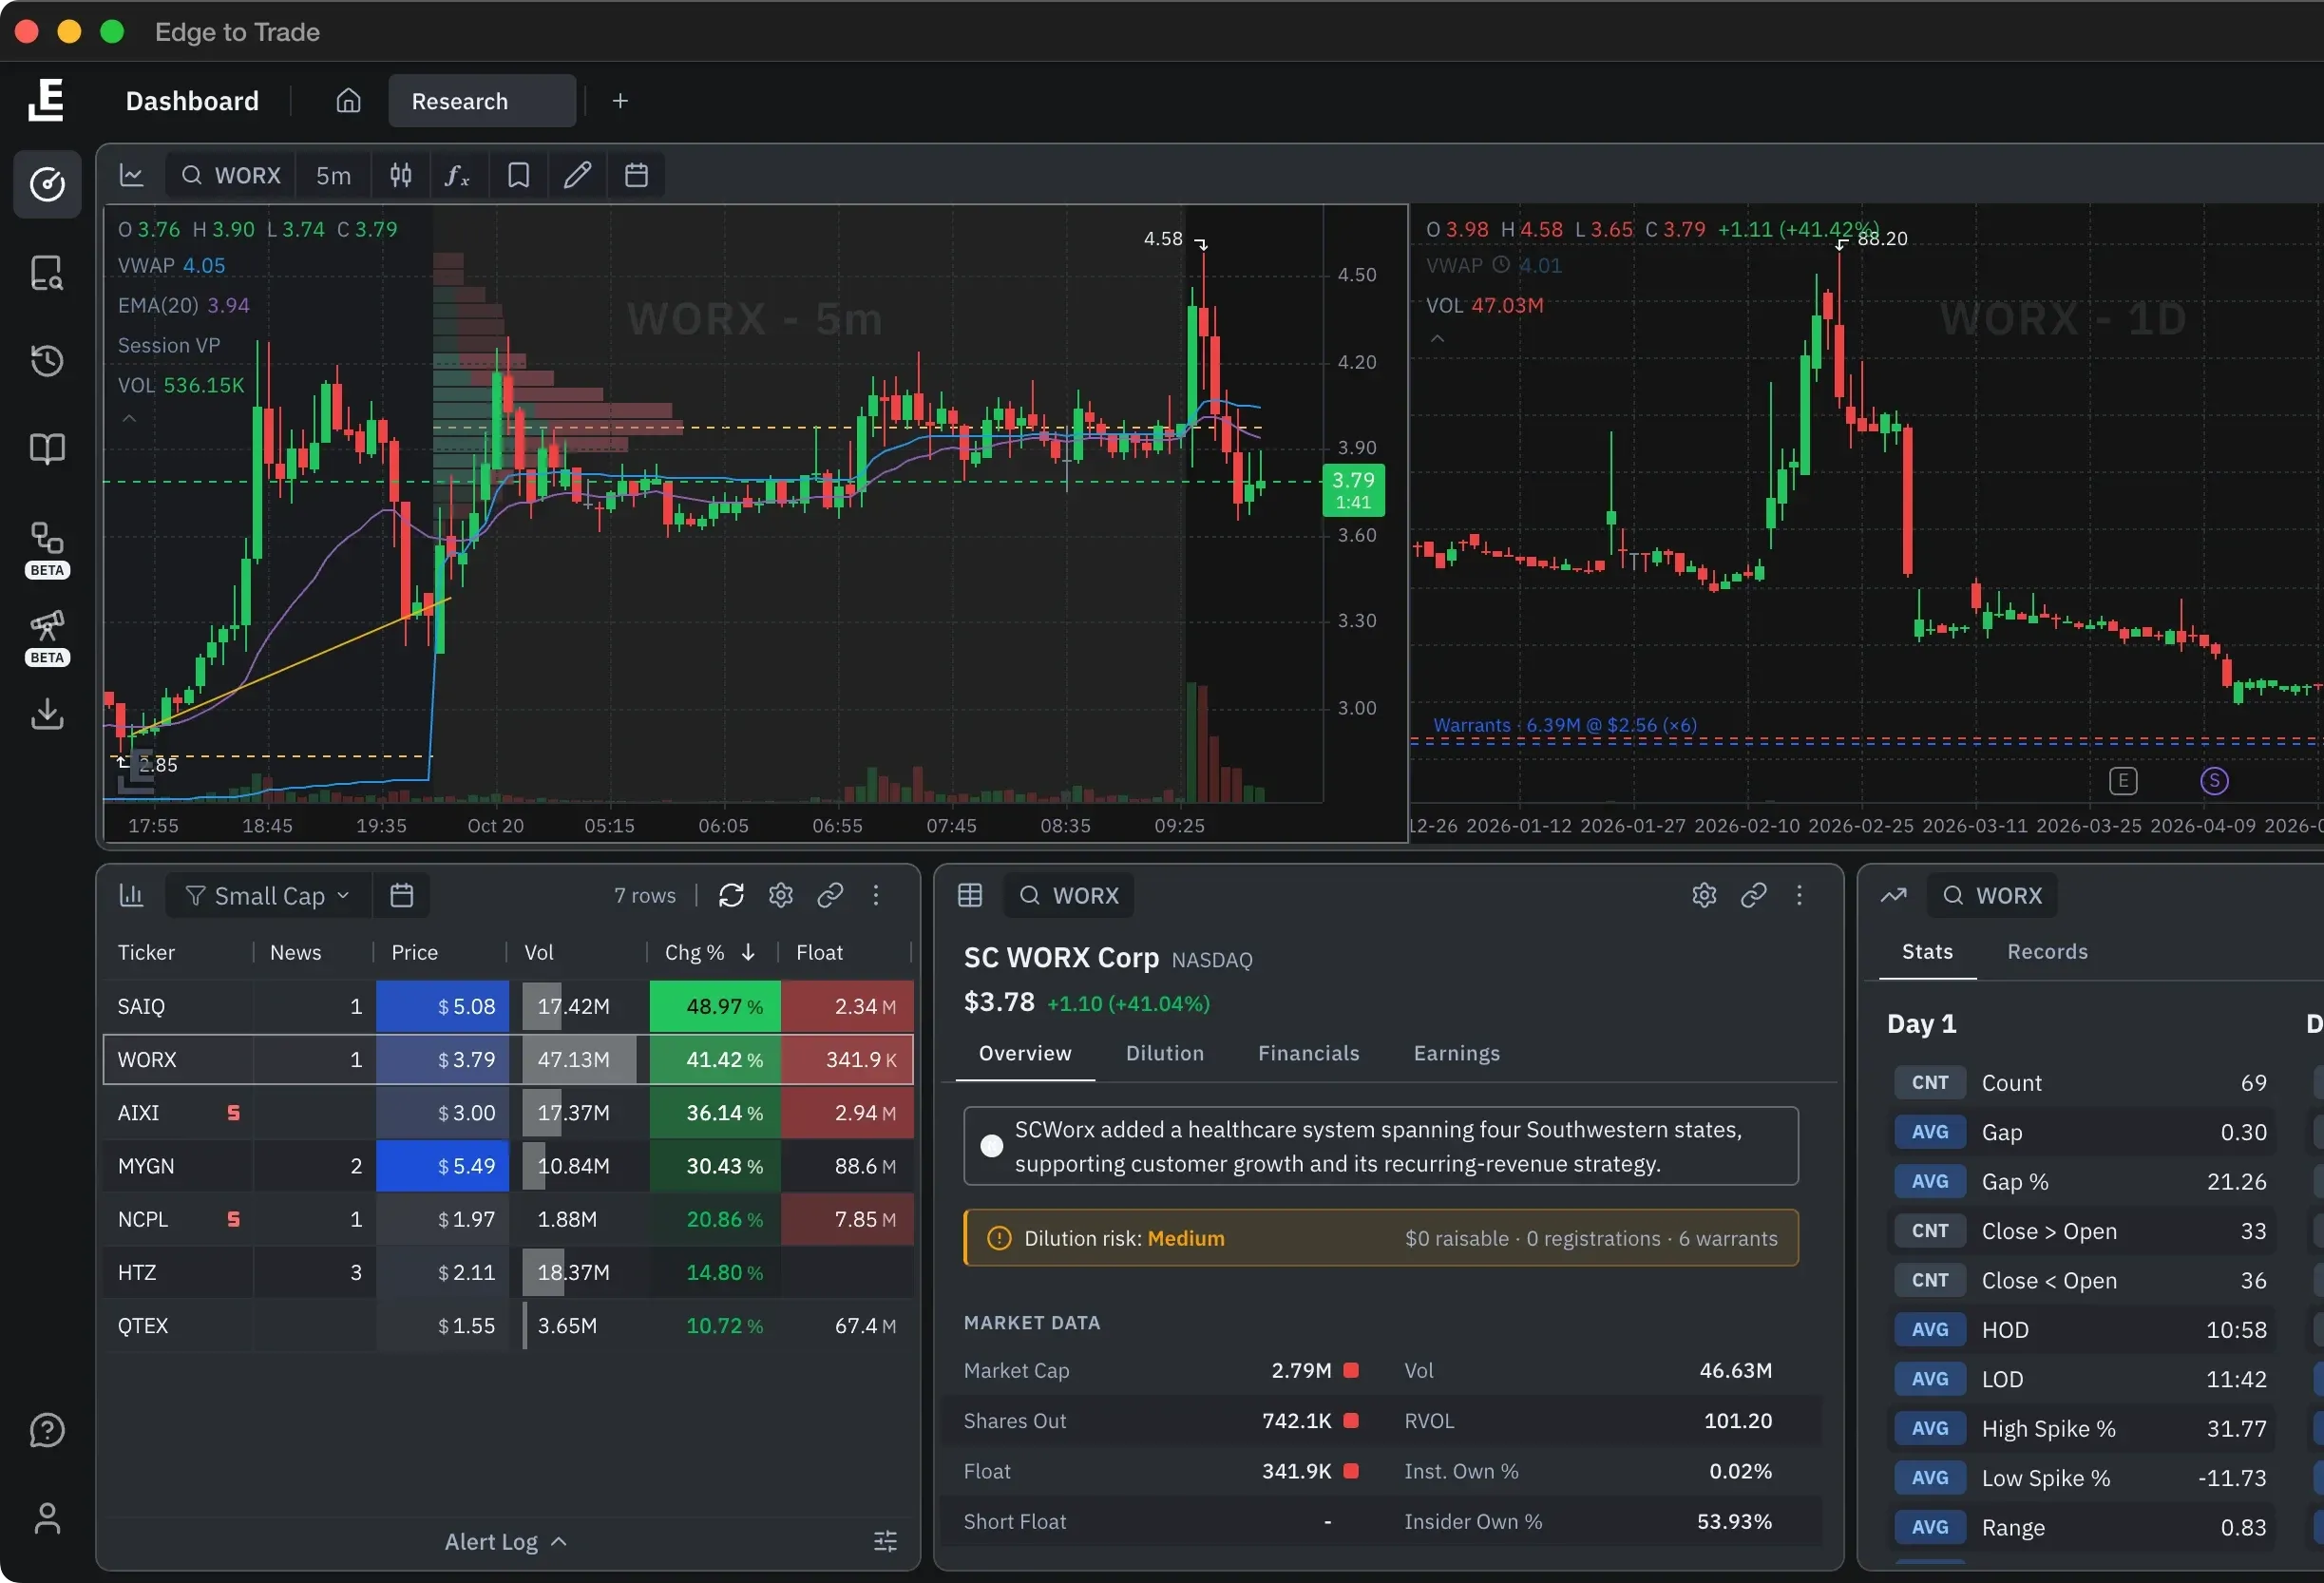
Ready to trade with an edge?
Join thousands of traders who rely on verified data and institutional-grade tools to make smarter decisions.
Pricing
Start with a 7-day trial. Choose the plan that fits your trading style.
Basic
Billed annually ($540/yr)
For individual traders getting started, whether discretionary or data-driven.
Pro
Billed annually ($960/yr)
Full platform access for serious traders who need an edge.
Pro+
Billed annually ($1500/yr)
Larger backtests, expanded AI, and data export.
Ultimate
Billed annually ($0/yr)
Until the Beta concludes, apply to join. Available for purchase afterwards.
(Only Pro+ customers can apply)
ApplyBook a demo with our team and we'll help you find the perfect fit for your trading workflow.
Compare Plans
See the unique features available in Edge to Trade. Try to find these anywhere else. We'll wait.
Basic
$49/mo
Pro
$89/mo
Pro+
$149/mo
Ultimate
Apply
(Only Pro+ customers can apply)
The platform
Conservative measurements against Edge to Trade's capabilities within the equities market.
In development (not used for the rating below)
| Percent of Edge to Trade features | |||||||||
|---|---|---|---|---|---|---|---|---|---|
Overall | 81%, 75–100% Close81% | 36%, 25–49% Limited36% | 24%, 0–24% Minimal24% | 19%, 0–24% Minimal19% | 15%, 0–24% Minimal15% | 23%, 0–24% Minimal23% | 21%, 0–24% Minimal21% | 28%, 25–49% Limited28% | 10%, 0–24% Minimal10% |
Scanning | 100%, 75–100% Close100% | 25%, 25–49% Limited25% | 60%, 50–74% Partial60% | 50%, 50–74% Partial50% | 25%, 25–49% Limited25% | 40%, 25–49% Limited40% | 45%, 25–49% Limited45% | 30%, 25–49% Limited30% | 0%, 0–24% Minimal0% |
Alerts | 70%, in development, not used in sorting70% | 50%, 50–74% Partial50% | 100%, 75–100% Close100% | 20%, 0–24% Minimal20% | 0%, 0–24% Minimal0% | 65%, 50–74% Partial65% | 40%, 25–49% Limited40% | 60%, 50–74% Partial60% | 0%, 0–24% Minimal0% |
Charting | 75%, 25% in development, 75–100% Close75% | 100%, 75–100% Close100% | 0%, 0–24% Minimal0% | 70%, 50–74% Partial70% | 15%, 0–24% Minimal15% | 15%, 0–24% Minimal15% | 5%, 0–24% Minimal5% | 15%, 0–24% Minimal15% | 0%, 0–24% Minimal0% |
Real world backtesting | 100%, 75–100% Close100% | 30%, 25–49% Limited30% | 5%, 0–24% Minimal5% | 0%, 0–24% Minimal0% | 35%, 25–49% Limited35% | 0%, 0–24% Minimal0% | 0%, 0–24% Minimal0% | 0%, 0–24% Minimal0% | 0%, 0–24% Minimal0% |
News | 70%, 50–74% Partial70% | 25%, 25–49% Limited25% | 0%, 0–24% Minimal0% | 10%, 0–24% Minimal10% | 5%, 0–24% Minimal5% | 60%, 50–74% Partial60% | 75%, 75–100% Close75% | 100%, 75–100% Close100% | 0%, 0–24% Minimal0% |
AI | 100%, 75–100% Close100% | 25%, 25–49% Limited25% | 25%, 25–49% Limited25% | 0%, 0–24% Minimal0% | 0%, 0–24% Minimal0% | 0%, 0–24% Minimal0% | 0%, 0–24% Minimal0% | 15%, 0–24% Minimal15% | 0%, 0–24% Minimal0% |
Historical analysis | 100%, 75–100% Close100% | 20%, 0–24% Minimal20% | 0%, 0–24% Minimal0% | 5%, 0–24% Minimal5% | 40%, 25–49% Limited40% | 0%, 0–24% Minimal0% | 0%, 0–24% Minimal0% | 0%, 0–24% Minimal0% | 0%, 0–24% Minimal0% |
Dilution & accurate float | 100%, 75–100% Close100% | 10%, 0–24% Minimal10% | 0%, 0–24% Minimal0% | 0%, 0–24% Minimal0% | 0%, 0–24% Minimal0% | 0%, 0–24% Minimal0% | 0%, 0–24% Minimal0% | 0%, 0–24% Minimal0% | 80%, 75–100% Close80% |
Everything you need to know about our plans and platform.
Yes! Our Basic, Pro, and Pro+ plans come with a 7-day trial that includes the features of your chosen plan. Data exports are limited to 10 rows during the trial.
Scanner Rewind lets you pick any past trading day and see what your scan returned that day (end-of-day values). Live-only columns such as dilution ratings aren't applied to past dates.
Our audited float data is cross-referenced against official SEC filings and includes shares outstanding, float size, institutional holdings, insider ownership, float rotation, and short float. You can scan directly against audited float on every plan.
Absolutely. You can upgrade or downgrade your plan at any time. When upgrading, you'll get immediate access to new features with a prorated charge. When downgrading, the change takes effect at your next billing cycle.
Pro, Pro+ and Ultimate plans include 14 years of historical data across the scanner, ticker stats, news, and deep analysis. You can pattern-match current setups against historical analogs, build custom graphs, and create custom metrics and aggregates.
Custom expressions let you build your own calculated columns and filters. Basic includes 1 for live panels (scanner, Multi-Strategy Scanner, watchlists) and 1 for History (History panels and ticker stats). Pro, Pro+, and Ultimate include 30 of each.
Yes, you save when you choose annual billing. For example, our Pro plan drops from $89/mo to $80/mo when billed annually. The discount is applied automatically when you toggle to annual pricing.
Every plan includes a 30-minute setup call via Zoom. Basic plans include chat support. Pro plans add Zoom support on demand plus 30 minutes of strategy support per month. Pro+ plans include 1.5 hours of strategy and custom setup support per month, and Ultimate includes 3 hours per month (30-minute or longer sessions).
Join thousands of traders who rely on verified data and institutional-grade tools to make smarter decisions.