Market DataPrice & PerformanceHigh

Multi-Day Highs %

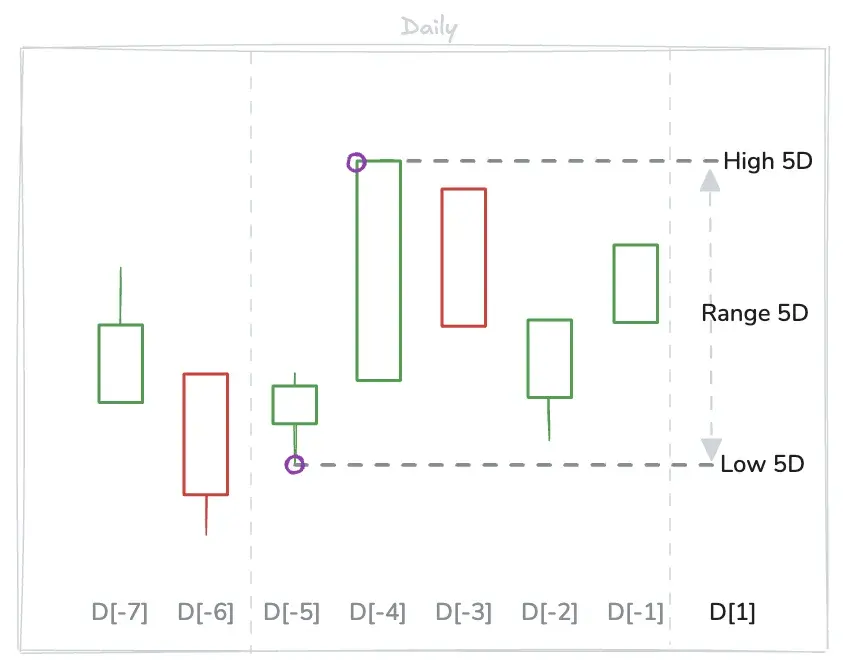
  • The Multi-Day Highs % metrics represent the percent distance between the highest High within a lookback period and the Close from the day before that lookback period began. For example, a 5 Day High% compares the highest High across the last 5 days to the Close from 6 days ago (the day before the 5-day period started).
Highest High in Lookback PeriodClose Before Lookback PeriodClose Before Lookback Period×100\frac{\text{Highest High in Lookback Period} - \text{Close Before Lookback Period}}{\text{Close Before Lookback Period}} \times 100
MetricDescription
Scan:2 Day High%Percent distance between the 2 Day High and the Previous Days Close
3 Day High%Percent distance between the 3 Day High and the Previous Days Close
4 Day High%Percent distance between the 4 Day High and the Previous Days Close
5 Day High%Percent distance between the 5 Day High and the Previous Days Close
10 Day High%Percent distance between the 10 Day High and the Previous Days Close
1 Month High%Percent distance between the 1 Month High and the Previous Days Close
3 Month High%Percent distance between the 3 Month High and the Previous Days Close
6 Month High%Percent distance between the 6 Month High and the Previous Days Close
1 Year High%Percent distance between the 1 Year High and the Previous Days Close
YTD High%Percent distance between the YTD High and the Previous Days Close
History:2 Day High%Percent distance between the 2 Day High and the Previous Days Close
3 Day High%Percent distance between the 3 Day High and the Previous Days Close
4 Day High%Percent distance between the 4 Day High and the Previous Days Close
5 Day High%Percent distance between the 5 Day High and the Previous Days Close
10 Day High%Percent distance between the 10 Day High and the Previous Days Close
1 Month High%Percent distance between the 1 Month High and the Previous Days Close
3 Month High%Percent distance between the 3 Month High and the Previous Days Close
6 Month High%Percent distance between the 6 Month High and the Previous Days Close
1 Year High%Percent distance between the 1 Year High and the Previous Days Close
YTD High%Percent distance between the YTD High and the Previous Days Close
High % Since IPOPercent distance between the High Since IPO and the Previous Days Close

Example: image_1