Market DataPrice & PerformanceHigh
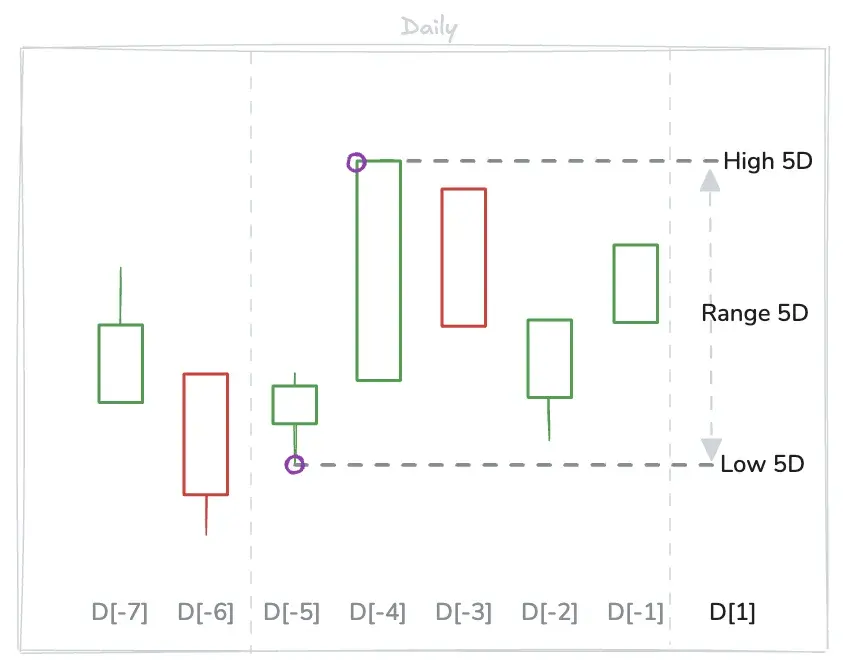
Multi-Day Highs

  • The Multi-Day Highs metrics represent the highest High price reached across various time periods, looking back from the target day.
MetricDescription
Scan:2 Day HighHighest High across the last 2 Days
3 Day HighHighest High across the last 3 Days
4 Day HighHighest High across the last 4 Days
5 Day HighHighest High across the last 5 Days
10 Day HighHighest High across the last 10 Days
1 Month HighHighest High across the last 1 Month
3 Month HighHighest High across the last 3 Months
6 Month HighHighest High across the last 6 Months
1 Year HighHighest High for the last Year
YTD HighHighest High for the Year to Date
History:2 Day HighHighest High across the last 2 Days
3 Day HighHighest High across the last 3 Days
4 Day HighHighest High across the last 4 Days
5 Day HighHighest High across the last 5 Days
10 Day HighHighest High across the last 10 Days
1 Month HighHighest High across the last 1 Month
3 Month HighHighest High across the last 3 Months
6 Month HighHighest High across the last 6 Months
1 Year HighHighest High for the last Year
YTD HighHighest High for the Year to Date
IPO HighHighest High since IPO

Example: image_1