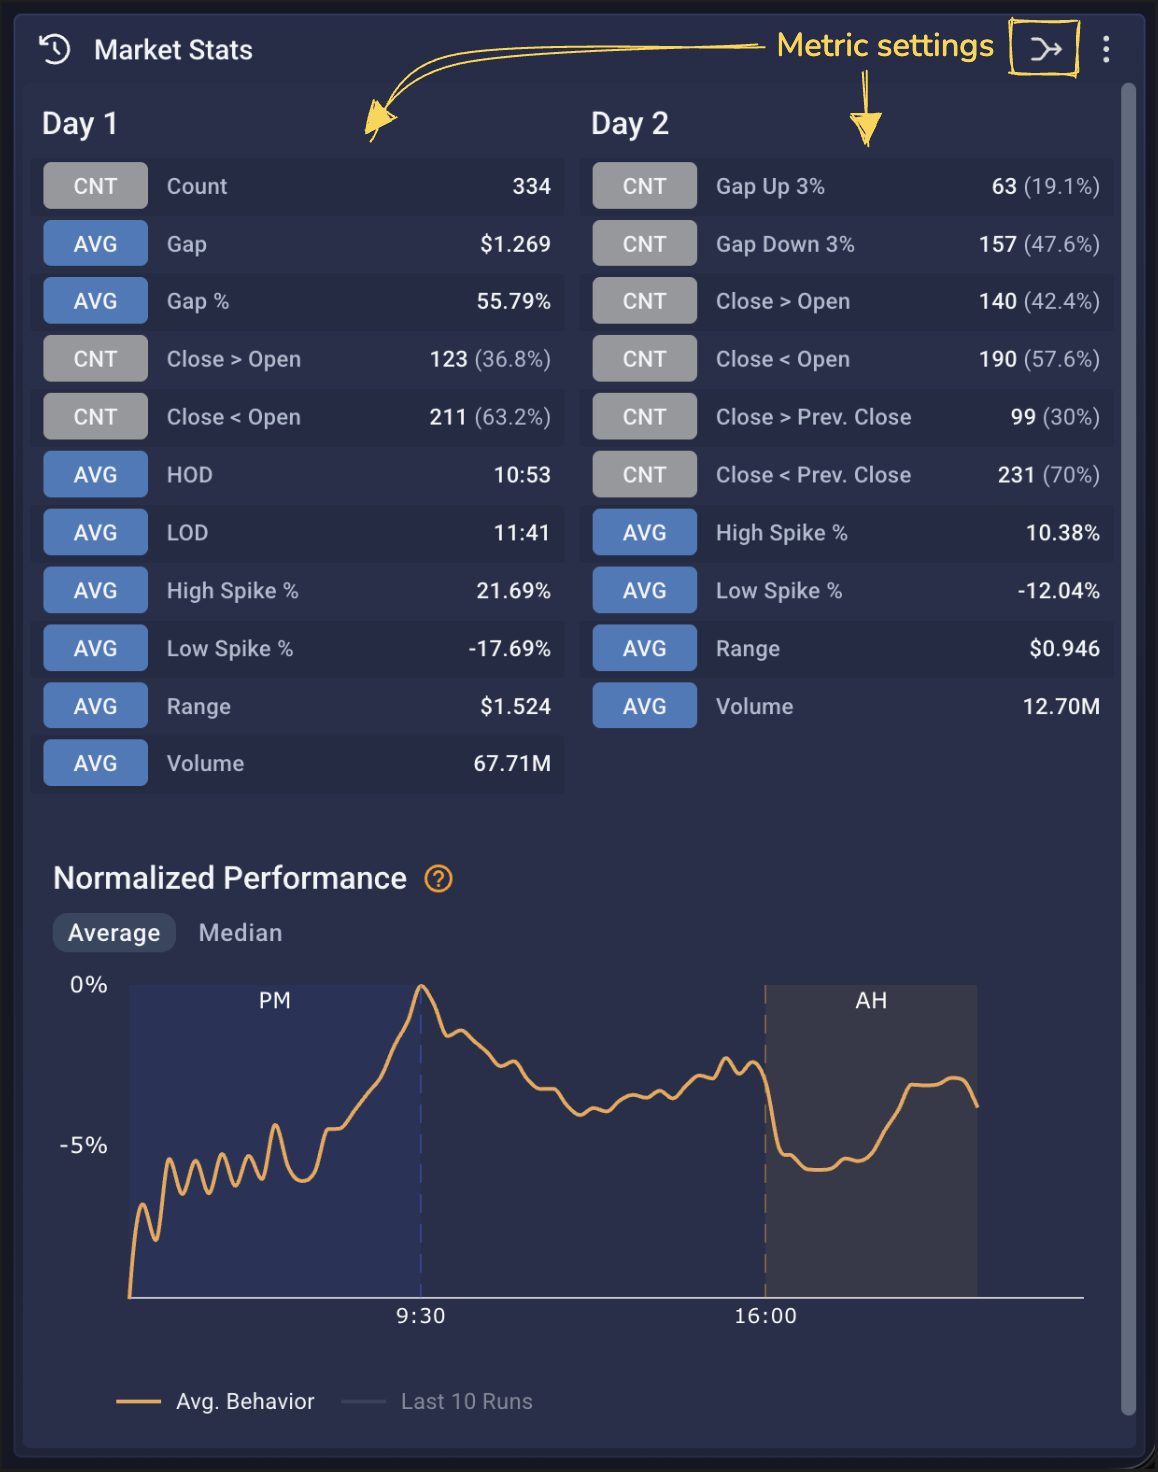
HISTORYMarket Stats
Metrics & Performance
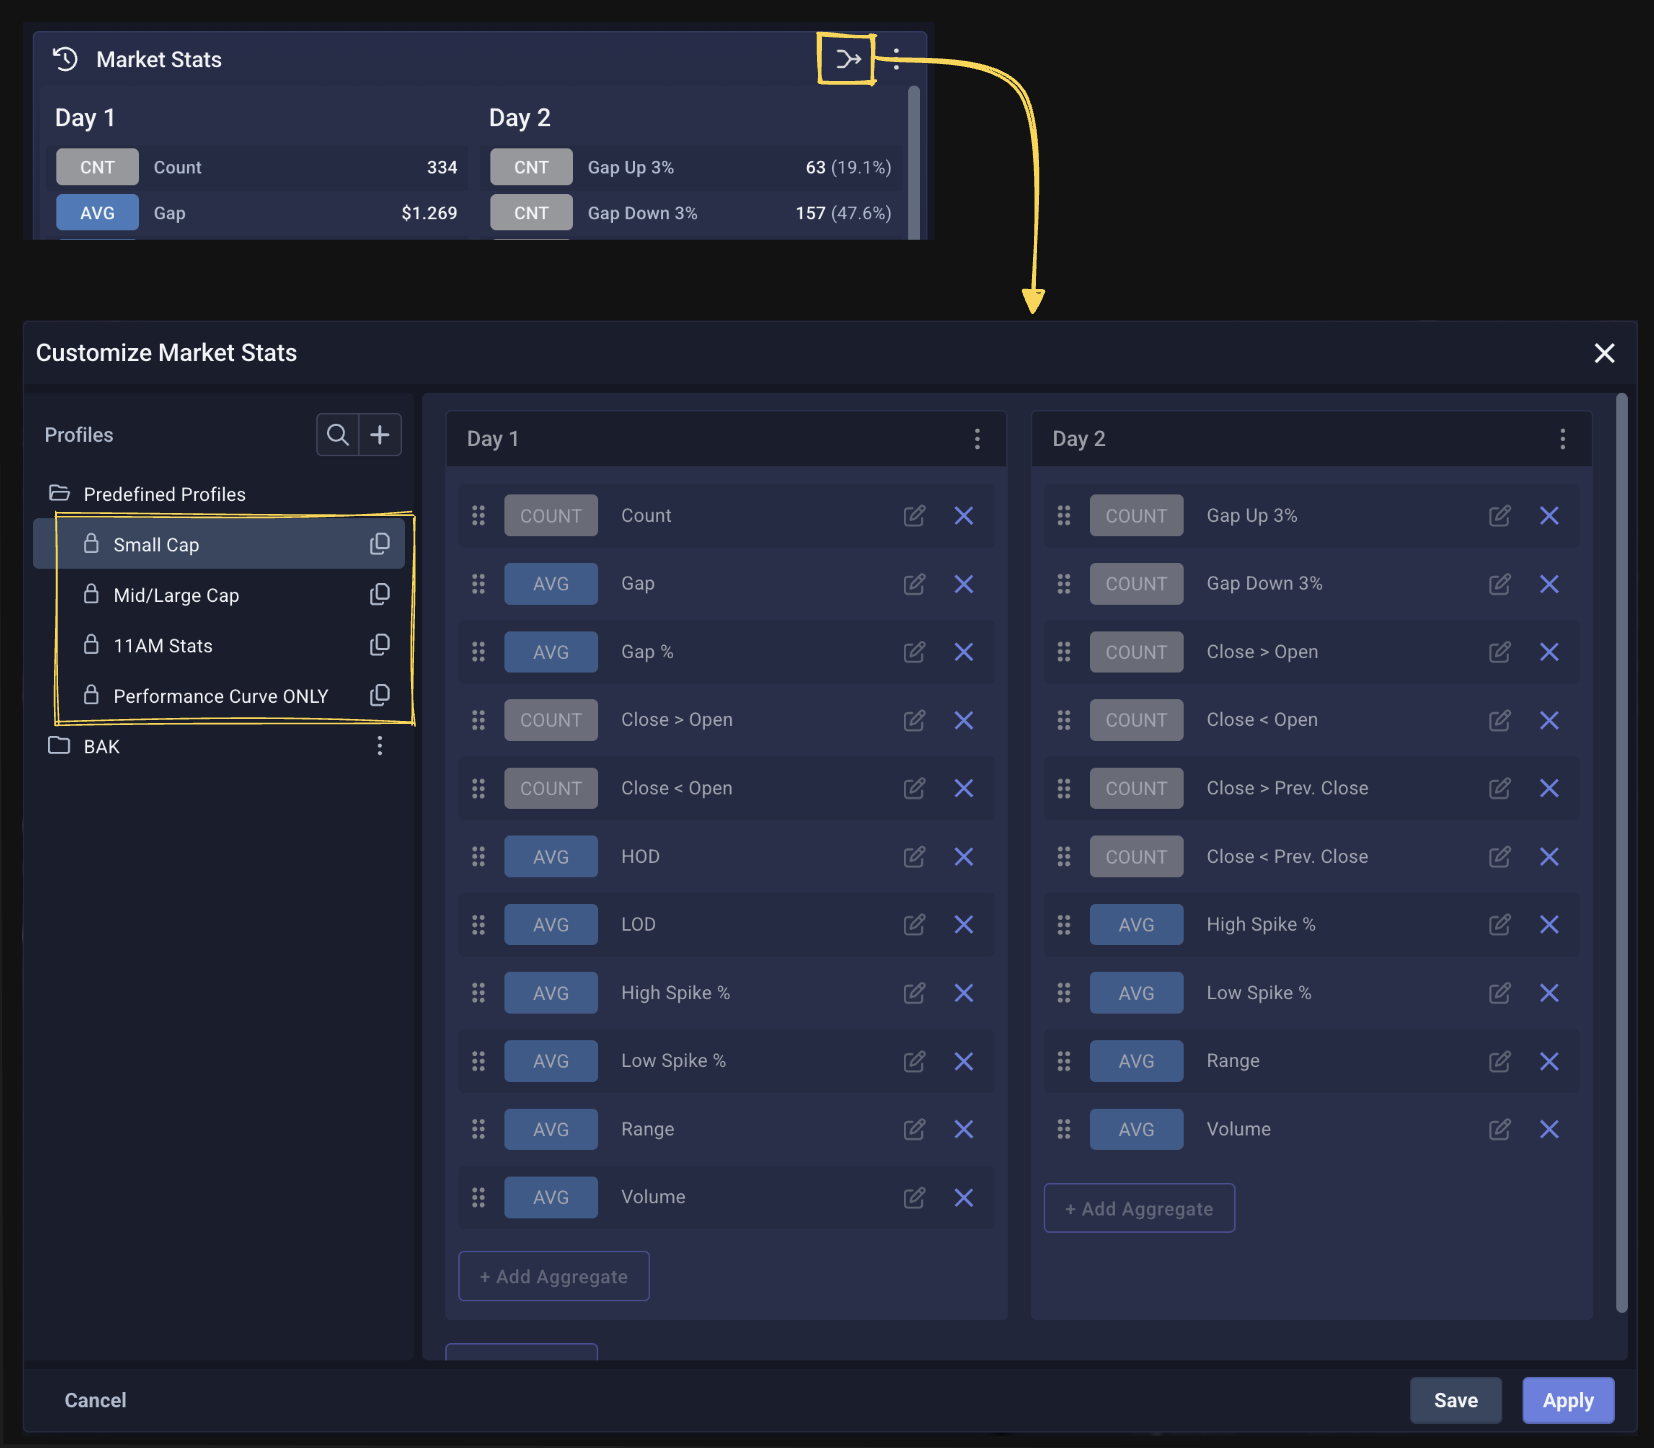
Load/Swap Metric Presets
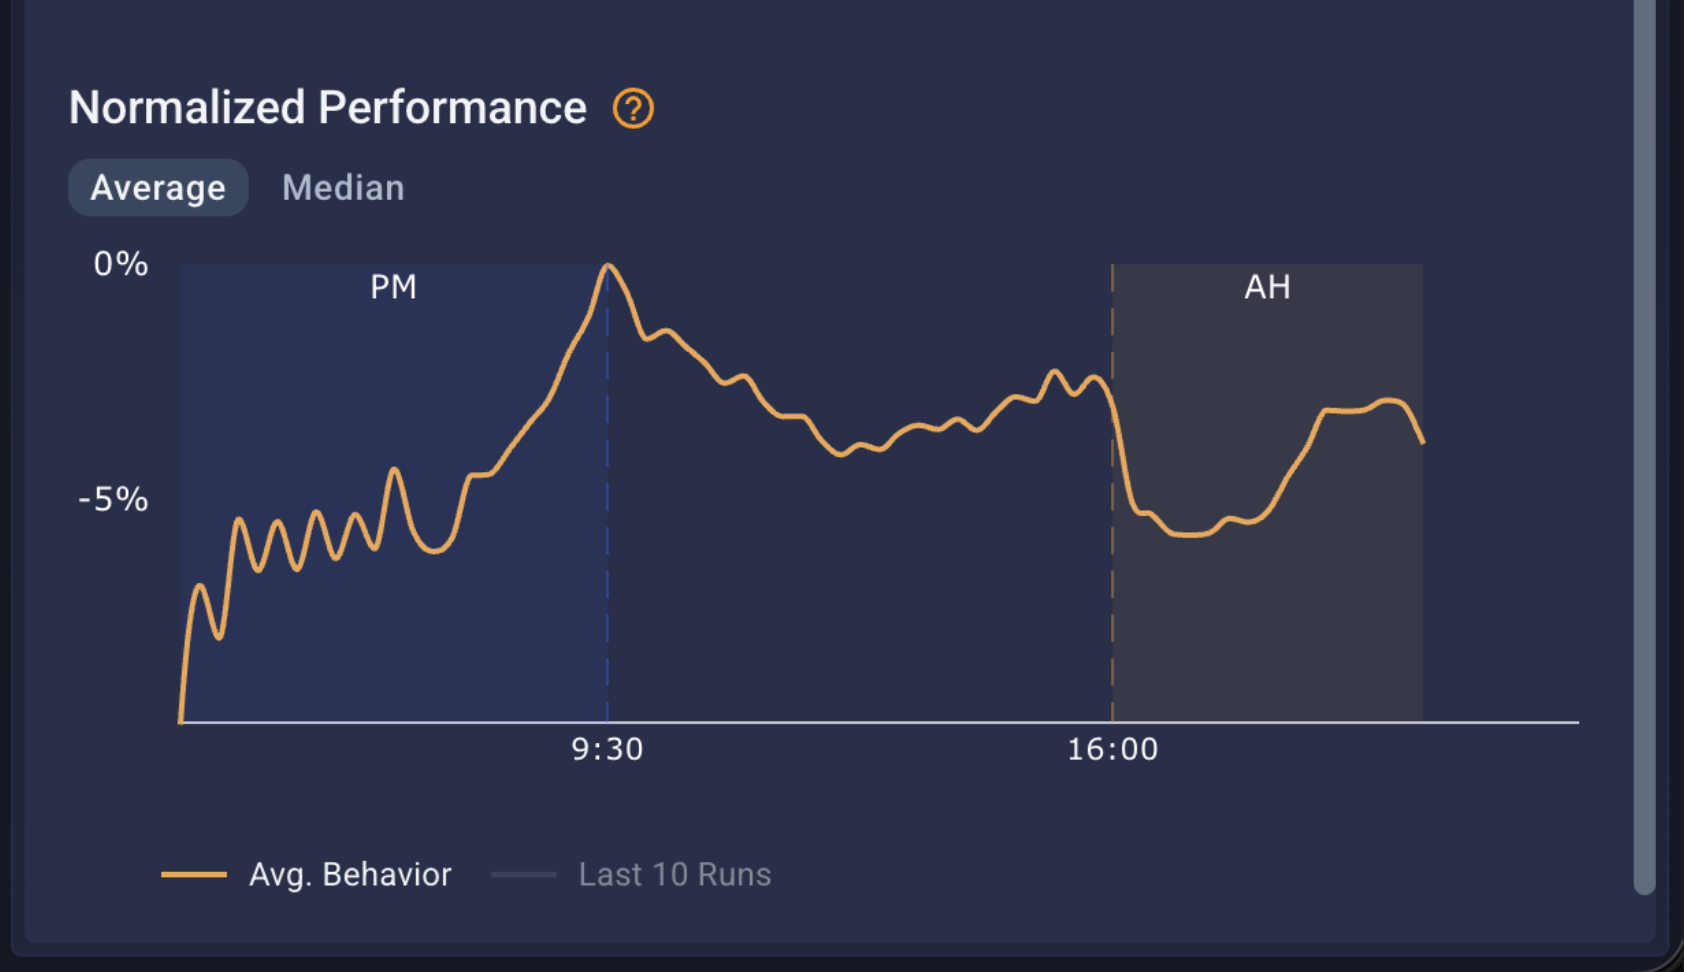
Normalized Performance
-
This chart shows price movements relative to the opening price (9:30) across the entire trading day, including pre-market and after-hours sessions. Data points are displayed at 15-minute intervals and all percentage changes are relative to the opening price. Pre-market activity is also compared to the opening price, allowing you to visualize how early movements relate to the official market open.
-
The Avg. Behavior line represents the average or median of all instances where a stock met this criteria, while the Last 10 Runs displays the last 10 occurrences that satisfied the filter criteria.